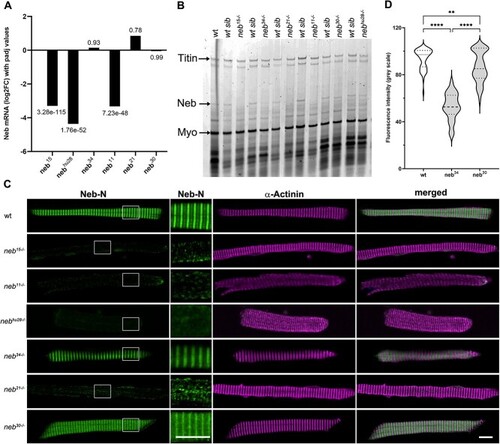
Nebulin expression is reduced in neb mutants. (A) Nebulin transcript levels, determined from the RNAseq data, were drastically reduced in the nonsense and nebhu28 mutants, whereas the levels in the splice mutants were consistent with those in the wt siblings (numbers indicate the padj values). (B) SDS-agarose gel stained with Coomassie blue showing reduced levels of nebulin in all mutants. (C) Confocal micrographs of myofibers stained with antibodies against Neb-N and α-Actinin. The nonsense, neb21, and nebhu28 mutants show altered localization and drastically reduced levels of nebulin. The localization pattern of nebulin in neb34 and neb30 splice mutants is similar to that in the wt myofibers; however, nebulin levels are significantly reduced. To better illustrate the altered localization of nebulin, the brightness in the region marked by the square in left column panels was increased to 150% in panels showing high magnification detail of Neb-N staining. Scale bars = 10 μm. (D) Quantification of fluorescence intensity of anti-Neb-N antibody staining in myofibers (mean ± SEM). Violin plot showing that fluorescence intensity is significantly reduced in neb34 and neb30 mutants compared to wt (56.5% in neb34 and 92.7% in neb30, respectively). n = 56 measurements/genotype. Asterisks indicate p-values (** ≤ 0.01; **** ≤ 0.0001). See Supplemental Table 1 for fluorescence intensity value measurements and statistics.
|
