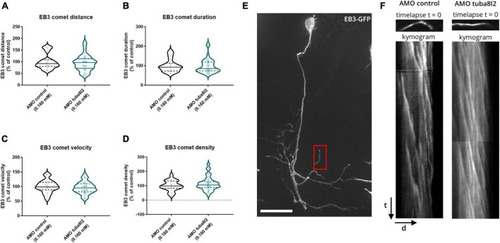
Zebrafish microtubule polymerization is not affected by tuba8l2 knockdown. At 48 hpf, an EB3 comet assay was performed in single CaP motor neurons after co-injection of an ATG morpholino against tuba8l2 (0.160 mM) or a control morpholino (0.160 mM). (a–d) Quantification of the comet run metrics extracted from kymograms show no difference in microtubule growth kinetics. (a) Average comet distance for AMO 0.160 mM (p = 0.8230) compared to AMO control condition. (b) Average comet duration for AMO 0.160 mM (p = 0.7340) compared to AMO control condition. (c) Average comet velocity for AMO 0.160 mM (p = 0.4605) compared to AMO control condition. (d) Average comet density for AMO 0.160 mM (p = 0.3741). Unpaired t-test (a) or Mann-Whitney test (b,c,d); N = 3 experiments; n = 20–37 zebrafish embryos with each data point representing an individual zebrafish embryo. (e) Representative image (composite z-stack projection) of EB3-GFP in AMO control zebrafish embryo. Red box: representative area for the comet analysis in a distal segment in the CaP. (f) Representative kymograms represent microtubule growth extracted through time-lapse imaging (500 ms/5 min) of EB3-GFP comets in single CaP motor neurons distal arbors at 48 hpf. Each pixel on the Y-axis represents one timepoint image (time) projected against the neurite length (distance) on the X-axis. AMO, morpholino; hpf, hours post fertilization; CaP, caudal primary; scale bar, 25 μm; t, time (5 min); d, distance (average: 17 μm segments).
|
