
Figure 6
- ID
- ZDB-FIG-230711-26
- Publication
- Lescouzčres et al., 2023 - A multilevel screening pipeline in zebrafish identifies therapeutic drugs for GAN
- Other Figures
- All Figure Page
- Back to All Figure Page
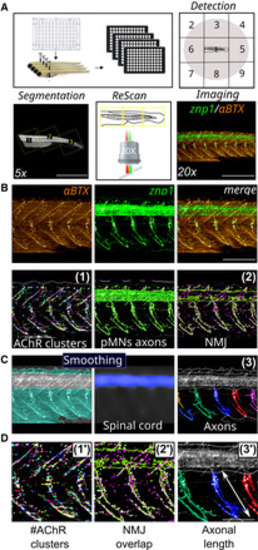
Filter II: Novel methodological analysis of automated imaging‐screening Schematic overview of 48‐h‐old embryos for automated detection in 96 well‐plates, ROI segmentation and Rescan imaging. Representative images of NMJ staining (znp1: green; αBTX: α‐bungarotoxin: red) within the spinal cord of control larvae. Representative images of the detection filters segmenting AChR clusters from α‐bungarotoxin staining (1), pMNs axon area from znp1 staining and NMJ overlapping compounds (2) within the spinal cord of control larvae. Representative image of the smoothing filter to extract the dorsal spinal cord staining as the specific region of interest to individualize axons (3). Enlarged pictures of the parameters (1′–3′) for the quantification of NMJ and pMN axons. Data information: Scale bar represents a length of 1 mm (A, 5×), 500 μm (A, 20×), 200 μm (B), 100 μm (D). |