
Figure 5
- ID
- ZDB-FIG-230711-25
- Publication
- Lescouzčres et al., 2023 - A multilevel screening pipeline in zebrafish identifies therapeutic drugs for GAN
- Other Figures
- All Figure Page
- Back to All Figure Page
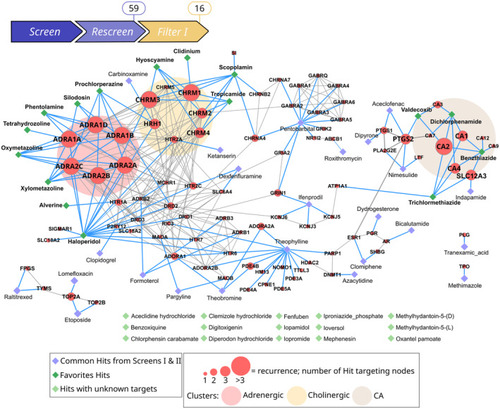
Filter I: Computational network analysis of the Hit targets identifies three functional groups and high recurrence, and refines candidates to 16 Hits Drug–Target list was constructed with known Drug–Target Interaction data extracted from DrugBank for the 59 candidate Hits. Subsequently, gene network of the 89 targets and interactions of the corresponding proteins were obtained from the STRING database (non‐interacting protein are removed here). Diamond‐shaped nodes correspond to drugs compounds as annotated in the DrugBank database and red nodes correspond to their targets (gene names presented here). Isolated diamonds (in light green) correspond to the 15 drugs with unknown targets. Edges corresponding to Target–Target interactions from STRING are indicated as solid gray lines, and Drug–Target interactions from DrugBank in blue lines. Recurrence analysis pinpoints a clustering of Hits into three functional groups with high recurrence, as depicted with ellipses: Adrenergic (light pink), Cholinergic (light yellow), CA (light brown). Target node size is scaled according to the number of drugs targeting the node and reflects recurrence. Recurrence of > 3 refines favorite drugs to 16 Hits (dark green diamond), represented in the three functional groups. |