
FIGURE
Fig. 5
- ID
- ZDB-FIG-230315-112
- Publication
- Zhang et al., 2022 - Deficiency of nde1 in zebrafish induces brain inflammatory responses and autism-like behavior
- Other Figures
- All Figure Page
- Back to All Figure Page
Fig. 5
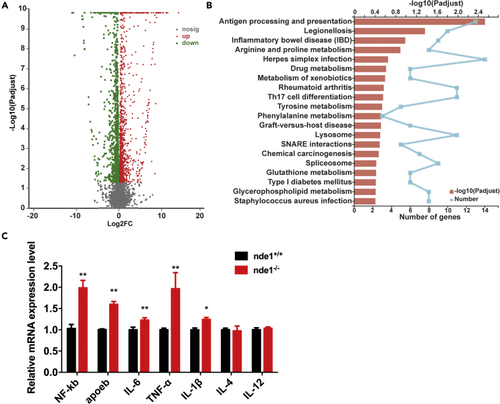
Transcriptome analysis of two mpf nde1?/? zebrafish brain tissue (A) Volcano plot of the gene expression profiles. Gray plot indicates no significance; red plot indicates upregulated genes; green plot indicates downregulated genes. (B) Twenty signaling pathways with the strongest significant differences in KEGG analysis. (C) Inflammatory cytokine and immune molecules expression in two mpf zebrafish brain tissue (n = 5). Data are presented as mean � SEM; ?p < 0.05, ??p < 0.01 |
Expression Data
| Genes: | |
|---|---|
| Fish: | |
| Anatomical Term: | |
| Stage: | Days 45-89 |
Expression Detail
Antibody Labeling
Phenotype Data
| Fish: | |
|---|---|
| Observed In: | |
| Stage: | Days 45-89 |
Phenotype Detail
Acknowledgments
This image is the copyrighted work of the attributed author or publisher, and
ZFIN has permission only to display this image to its users.
Additional permissions should be obtained from the applicable author or publisher of the image.
Full text @ iScience