
Fig. 2
- ID
- ZDB-FIG-221115-16
- Publication
- Silic et al., 2021 - Phylogenetic and developmental analyses indicate complex functions of Calcium-Activated Potassium Channels in zebrafish embryonic development
- Other Figures
- All Figure Page
- Back to All Figure Page
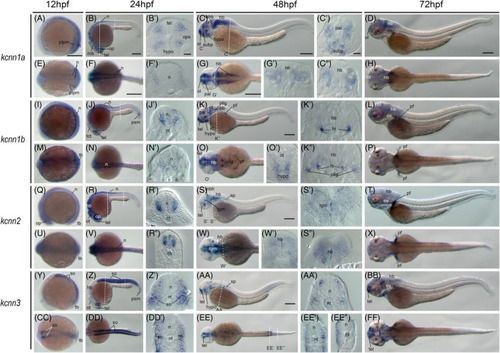
Gene expression of small?conductance calcium?activated potassium channel genes in early zebrafish embryos. Whole?mount in situ hybridization of zebrafish embryos at stages 12hpf (A, E, I, M, Q, U, Y, CC), 24hpf (B, F, J, N, R, V, Z, DD), 48hpf (C, G, K, O, S, W, AA, EE), and 72hpf (D, H, L, P, T, X, BB, FF). Anterior is to the left in all the whole?mount images, and dorsal is to the top in all transverse sections. Each embryo was imaged from the lateral and dorsal perspective, respectively. A?D, Lateral view of gene expression of kcnn1a. E?H, Dorsal view of gene expression of kcnn1a. I?L, Lateral view of gene expression of kcnn1b. M?P, Dorsal view of gene expression of kcnn1b. Q?T, Lateral view of gene expression of kcnn2. U?X, Dorsal view of gene expression of kcnn2. Y?BB, Lateral view of gene expression of kcnn3. CC?FF, Dorsal view of gene expression of kcnn3. The dashed lines indicate the approximate positions of sections. The letters below or around the dashed lines correspond to the section panels. Scale bars are added on the top row of images; 250 ?m for whole mount images and 50 ?m for tissue sections. e, eye; hb, hind brain; hi, intermediate hypothalamus, hypo, hypothalamus; mb, midbrain; mhb, midbrain?hindbrain boundary; n, neural tube; nt, notochord; ol, olfactory placodes/organ; op, optic vesicle; ot, optic tectum; ov, otic vesicle; pal, pallium; pf, pectoral fin; pllg, posterior lateral line ganglia; plpm, posterior lateral plate mesoderm; psm, presomitic mesoderm; so, somite; sp, spinal cord; subp, subpallium; tb, tailbud; tel, telencephalon; tgm, tegmentum |