
Fig. 2
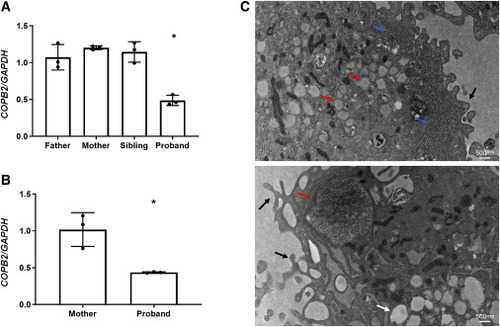
Figure 2. COPB2 haploinsufficiency results in abnormal cellular morphology (A) COPB2 qPCR in lymphoblastoid cells from subject 1 (proband) showing decreased COPB2 expression by about 50% compared to expression in parents and sibling. (B) COPB2 qPCR in skin fibroblasts from subject 2 (proband) and her mother showing decreased COPB2 expression by about 50% compared to expression in parent. Results shown as COPB2/GAPDH relative mRNA expression, ?p = 0.0002 (one-way ANOVA) for subject 1, and ?p = 0.002 (t test) for subject 2. (C) Electron microscopy of subject 2 fibroblasts showing dilated ER containing granular matrix (red arrows), prominent rough ER (blue arrows), vacuoles (white arrow), and dominant pseudopodia on the cytoplasmic membrane (black arrows). |