Fig. 2
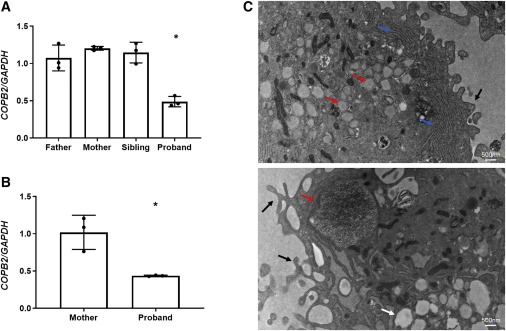
Figure 2. COPB2 haploinsufficiency results in abnormal cellular morphology (A) COPB2 qPCR in lymphoblastoid cells from subject 1 (proband) showing decreased COPB2 expression by about 50% compared to expression in parents and sibling. (B) COPB2 qPCR in skin fibroblasts from subject 2 (proband) and her mother showing decreased COPB2 expression by about 50% compared to expression in parent. Results shown as COPB2/GAPDH relative mRNA expression, ?p = 0.0002 (one-way ANOVA) for subject 1, and ?p = 0.002 (t test) for subject 2. (C) Electron microscopy of subject 2 fibroblasts showing dilated ER containing granular matrix (red arrows), prominent rough ER (blue arrows), vacuoles (white arrow), and dominant pseudopodia on the cytoplasmic membrane (black arrows).
Image
Figure Caption
Acknowledgments
This image is the copyrighted work of the attributed author or publisher, and
ZFIN has permission only to display this image to its users.
Additional permissions should be obtained from the applicable author or publisher of the image.
Full text @ Am. J. Hum. Genet.

