
Fig. 5
- ID
- ZDB-FIG-220714-39
- Publication
- Beckers et al., 2023 - Optic nerve injury-induced regeneration in the adult zebrafish is accompanied by spatiotemporal changes in mitochondrial dynamics
- Other Figures
- All Figure Page
- Back to All Figure Page
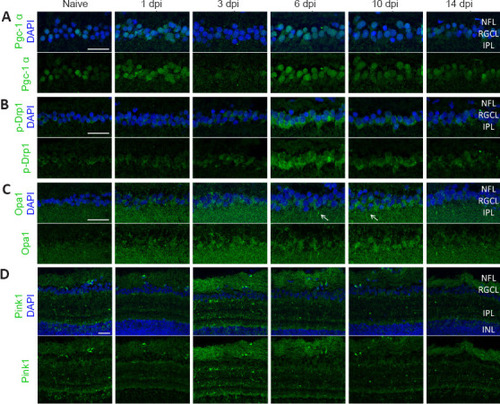
Immunofluorescent stainings for Pgc-1?, p-Drp1, Opa1, and Pink1 on cryosections of WT retinas, harvested at baseline (naive) or after ONC injury. (A) Representative images of retinal cryosections at various time points after ONC stained for Pgc-1? (green), reveal an increased expression of the biogenesis marker in RGC somas at 1 day post optic nerve damage, as well as from 6?10 dpi. (B) Fission was increased in RGC somas from 3?10 dpi, with the highest visible expression at 6 dpi, as shown using the p-Drp1 marker (green). (C) Stainings for Opa1 (green) at various time points after ONC do not show major differences in expression over time, although a marginal increase in Opa1 fluorescence was observed in the RGCL, which seems sporadically clustered in primary RGC dendrites close to the RGCL (arrows). (D) Lastly, mitophagy, visualized via immunostaining for Pink1, was increased at 3 and 6 dpi in both the NFL and IPL. In all panels, upper row images include the DAPI counterstaining (blue). Scale bars: 25 �m, representative images of n = 4 fish per condition. Dpi: Days post-injury; IPL: inner plexiform layer; NFL: nerve fiber layer; ONC: optic nerve crush; Opa1: optic atrophy 1 protein; p-Drp1: phosphorylated Drp1; Pgc-1?: proliferator-activated receptor gamma co-activator 1; Pink1: phosphatase and tensin homologue-induced putative kinase 1; RGCL: retinal ganglion cell layer. |