
Fig. 2
- ID
- ZDB-FIG-220714-36
- Publication
- Beckers et al., 2023 - Optic nerve injury-induced regeneration in the adult zebrafish is accompanied by spatiotemporal changes in mitochondrial dynamics
- Other Figures
- All Figure Page
- Back to All Figure Page
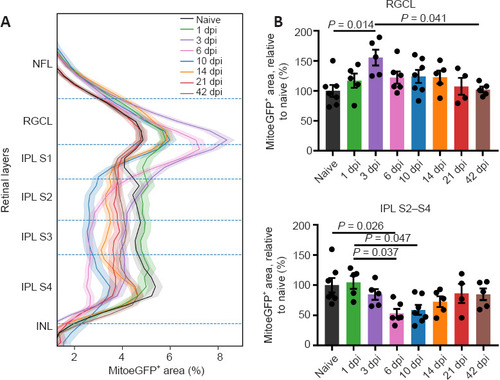
Inner retinal MitoeGFP+ area profile, combined with bar graphs representing the results per retinal layer, at baseline (naive) or after ONC injury. (A) Profiles of the MitoeGFP+ area covering all inner retinal layers at different time points after injury. (B) In the IPL sublaminae S2?S4, the mitochondrial area is decreased after injury, and baseline mitochondrial levels are re-reached from three weeks onwards. A transient rise in mitochondrial mass at 3 dpi was visible in the RGCL. Data represent mean � 95% confidence intervals, n = 4?76 per condition, one-way analysis of variance followed by Tukey?s post hoc test. Dpi: Days post-injury; GFP: green fluorescent protein; INL: inner nuclear layer; IPL: inner plexiform layer; MitoeGFP: mitochondrial targeting sequence fused to enhanced GFP; NFL: nerve fiber layer; ONC: optic nerve crush; RGCL: retinal ganglion cell layer. |