
Fig. 4
- ID
- ZDB-FIG-220714-38
- Publication
- Beckers et al., 2023 - Optic nerve injury-induced regeneration in the adult zebrafish is accompanied by spatiotemporal changes in mitochondrial dynamics
- Other Figures
- All Figure Page
- Back to All Figure Page
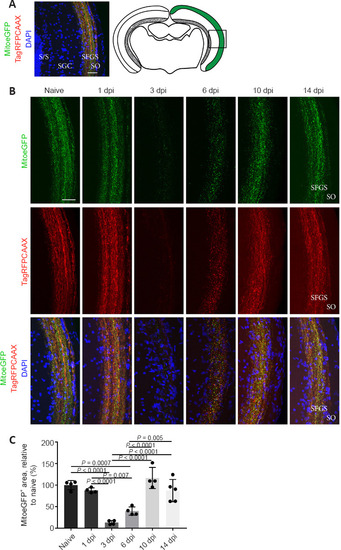
Mitochondrial distribution visualized on vibratome sections of MitoeGFP+ optic tecti, harvested at baseline (naive) or after ONC injury. (A) MitoeGFP+ mitochondria (green) can be observed in the RGC axon terminals (red), which were visualized using a membrane tag and located in the SO and SFGS of the zebrafish optic tectum. Nuclei were counterstained using DAPI (blue). The right panel depicts a schematic overview of a central coronal section of the optic tectum, with the magnified area indicated with a box. (B) Detailed images show that a bright overlap of labeled mitochondria (green) and axon terminals (red) was still visible in the optic tectum 1 day after ONC, both fluorescent signals were almost absent at 3 dpi. The axonal labeling as well as the GFP+ mitochondria reappeared to some extent at 6 dpi and baseline axonal/mitochondrial expression was restored from 10 dpi onwards. Note that the lower row panel shows the merged images, including counterstained nuclei using DAPI (blue). (C) Quantification of the MitoeGFP+ area in the SO and SFGS of the optic tectum confirmed that nearly all mitochondria were removed at 3 dpi, but that they gradually returned from 6 dpi onwards. Data represent the mean � SEM, n = 4?5 fish per condition, one-way analysis of variance and Tukey?s post hoc test. Scale bars: 25 �m. DAPI: 4?,6-Diamidino-2-phenylindole; Dpi: days post-injury; GFP: green fluorescent protein; MitoeGFP: mitochondrial targeting sequence fused to enhanced GFP; ONC: optic nerve crush; RFP: red fluorescent protein; SGC: stratum griseum centrale; SFGS: stratum fibrosum et griseum superficiale; SO: stratum opticum; S/S: zone between album centrale and stratum periventriculare; TagRFP: membrane tag fused to RFP. |