
Fig. 3
- ID
- ZDB-FIG-220714-37
- Publication
- Beckers et al., 2023 - Optic nerve injury-induced regeneration in the adult zebrafish is accompanied by spatiotemporal changes in mitochondrial dynamics
- Other Figures
- All Figure Page
- Back to All Figure Page
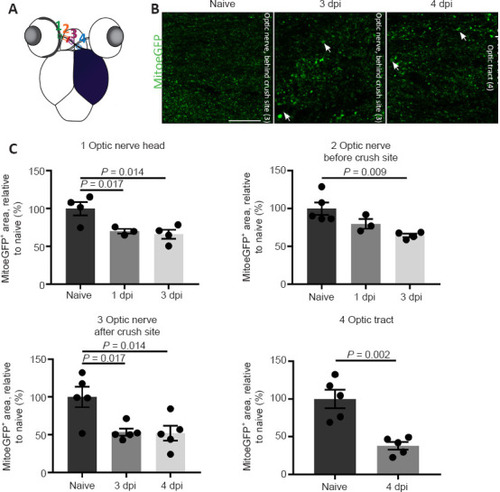
Mitochondrial distribution visualized and quantified on cryosections of MitoeGFP+ visual systems, harvested at baseline (naive) or after ONC injury. (A) Schematic overview of the four areas used to quantify mitochondrial density in the optic nerve/tract: 1) optic nerve head; 2) optic nerve before crush site; 3) optic nerve after crush site; 4) optic tract. (B) Compared to control fish, the number of mitochondria was reduced in all regions of the injured nerve, here visualized on representative parts of the optic nerve and tract at 3 and 4 dpi, respectively. Strikingly, mitochondria located after the crush site in the optic nerve/tract were often increased in size (white arrows). (C) Quantification of the MitoeGFP+ area confirmed a reduced mitochondrial density early after ONC, in the optic nerve head, optic nerve, and optic tract. Data represent the mean � SEM, n = 3?5 fish per condition, one-way analysis of variance followed by Tukey?s post hoc test. Scale bar: 25 �m. Dpi: Days post-injury; GFP: green fluorescent protein; MitoeGFP: mitochondrial targeting sequence fused to enhanced GFP; ONC: optic nerve crush. |