
FIGURE
Fig. 1
- ID
- ZDB-FIG-220628-99
- Publication
- Morrison et al., 2022 - Single-cell transcriptomics reveals conserved cell identities and fibrogenic phenotypes in zebrafish and human liver
- Other Figures
- All Figure Page
- Back to All Figure Page
Fig. 1
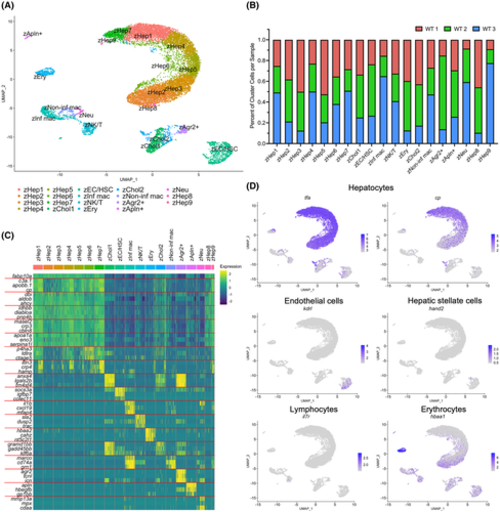
Single-cell transcriptome of the adult zebrafish liver. (A) scRNA-seq of WT adult zebrafish liver cells (n = 3). UMAP shows 19 unique clusters. (B) Bar graph showing the percentage of cells contributed to each cluster from each sample. (C) Heatmap of gene expression for three of the top differentially expressed genes in each cluster. (D) UMAP visualization of marker gene expression for hepatocytes (tfa and cp), ECs (kdrl), HSCs (hand2), lymphocytes (il7r), and erythrocytes (hbaa1)
|
Expression Data
Expression Detail
Antibody Labeling
Phenotype Data
Phenotype Detail
Acknowledgments
This image is the copyrighted work of the attributed author or publisher, and
ZFIN has permission only to display this image to its users.
Additional permissions should be obtained from the applicable author or publisher of the image.
Full text @ Hepatol Commun