
- Title
-
Single-cell transcriptomics reveals conserved cell identities and fibrogenic phenotypes in zebrafish and human liver
- Authors
- Morrison, J.K., DeRossi, C., Alter, I.L., Nayar, S., Giri, M., Zhang, C., Cho, J.H., Chu, J.
- Source
- Full text @ Hepatol Commun
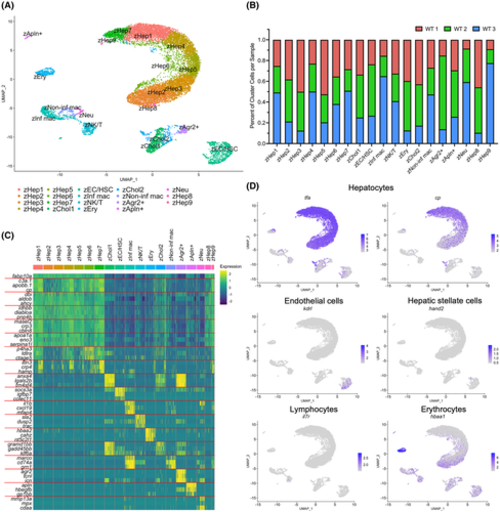
Single-cell transcriptome of the adult zebrafish liver. (A) scRNA-seq of WT adult zebrafish liver cells (n = 3). UMAP shows 19 unique clusters. (B) Bar graph showing the percentage of cells contributed to each cluster from each sample. (C) Heatmap of gene expression for three of the top differentially expressed genes in each cluster. (D) UMAP visualization of marker gene expression for hepatocytes (tfa and cp), ECs (kdrl), HSCs (hand2), lymphocytes (il7r), and erythrocytes (hbaa1)
|
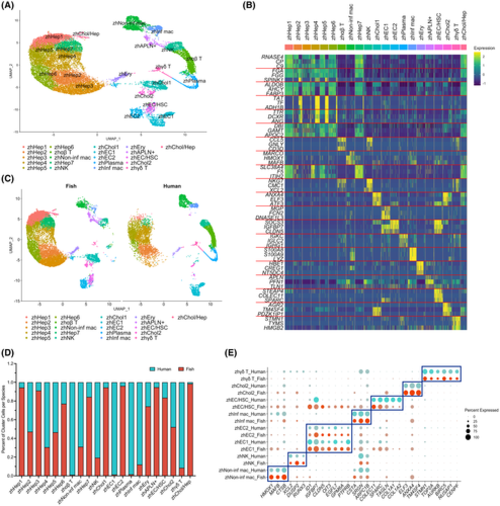
Joint clustering of adult human and zebrafish liver scRNA-seq. (A) UMAP visualization of 21 clusters comprised of 8,444 adult human liver and 13,630 adult zebrafish liver cells. (B) Heatmap of gene expression for three of the top differentially expressed genes in each cluster. (C) UMAP of joint human and zebrafish clustering split by species. (D) Bar graph showing the percentage of cells contributed to each cluster from each species. (E) Dot plot showing differential expression of human cell type marker genes in select clusters split by species to show marker conservation
|
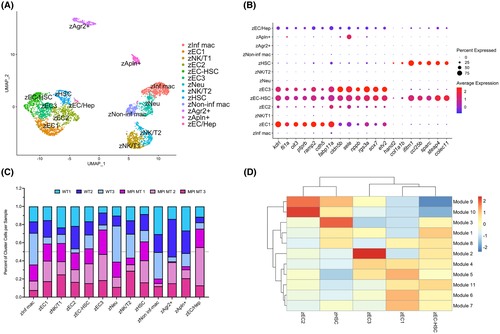
Characterization of zebrafish HSCs and ECs. (A) UMAP visualization of 13 clusters comprised of WT and mpi+/mss7 adult zebrafish liver cells subset from total liver cell clustering. (B) Dot plot of gene expression for top DEGs in clusters zEC1, zEC2, zEC3, zEC-HSC, and zHSC. (C) Bar graph showing the percentage of cells contributed to each cluster from each sample. (D) Heatmap showing expression of modules of coregulated genes correlating with EC and HSC clusters
|
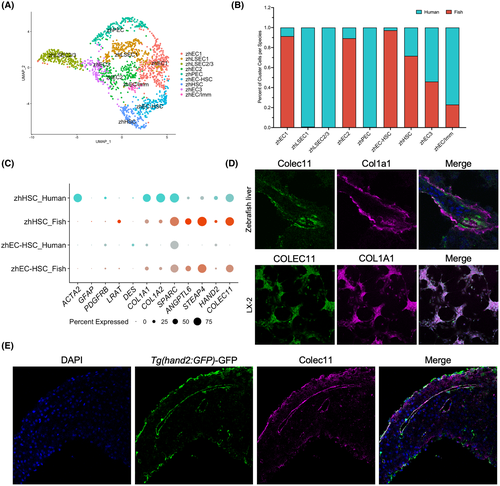
Joint clustering of adult human and zebrafish ECs and HSCs. (A) UMAP visualization of nine clusters comprised of adult human liver and adult zebrafish liver ECs and HSCs. (B) Bar graph showing the percentage of cells contributed to each cluster from each species. (C) Dot plot showing differential expression of HSC marker genes split by species to show marker conservation. (D) Immunofluorescent staining for COLEC11 and COL1A1 on WT adult zebrafish liver cryosections (imaged at magnification �63) and LX-2 cells (imaged at magnification �20). (E) Immunofluorescent staining for GFP under the hand2 promoter and COLEC11 on WT adult zebrafish liver cryosections (imaged at magnification �63). zhEC/Imm, endothelial cell/immune cell mix
EXPRESSION / LABELING:
|
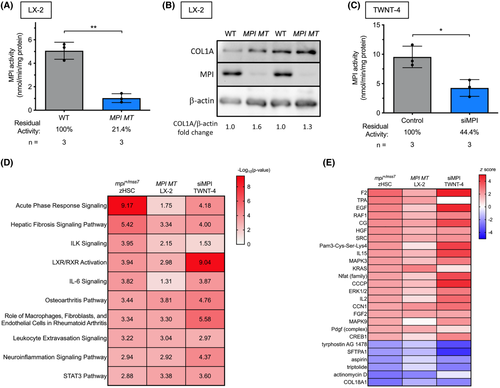
Activation phenotypes are conserved across human and zebrafish HSCs. (A) Bar graph showing MPI enzymatic activity in WT and MPI MT LX-2 cells. (B) Western blot for MPI and COL1A in WT and MPI MT LX-2 cells. (C) Bar graph showing MPI enzymatic activity in control and siMPI TWNT-4s. (D,E) IPA conducted on DGE from the following three data sets: mpi+/mss7 zebrafish single-cell HSCs (zHSCs), MPI mutant LX-2 HSCs, and siMPI TWNT-4 HSCs. Heatmaps display (D) ?log10(p values) for canonical pathway activity alteration and (E) z score of activation/inhibition of upstream regulators. *p < 0.05, **p < 0.01. ILK, integrin-linked kinase; LXR, liver X receptor; RXR, retinoid X receptor; STAT3, signal transducer and activator of transcription 3
|
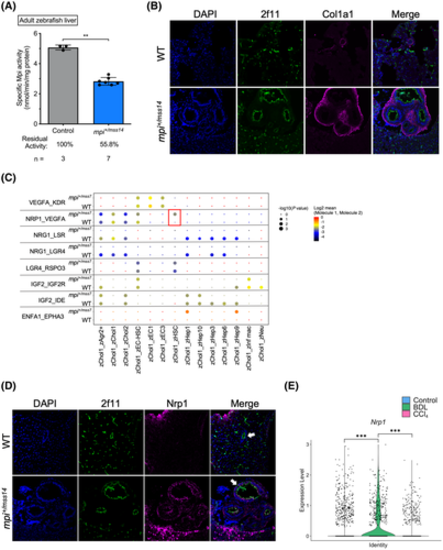
Identifying key alterations in Mpi-depleted cholangiocytes. (A) Bar graph showing Mpi enzymatic activity in WT and mpi+/mss14 adult zebrafish livers. (B) Immunofluorescent staining for 2f11 and Col1a1 on WT and mpi+/mss14 adult zebrafish liver cryosections imaged at magnification �63. (C) Dot plot of receptor?ligand interaction scores determined by CellPhoneDB analysis of scRNA-seq gene expression in WT and mpi+/mss7 zebrafish liver cells. Dot color indicates log2(mean expression score) with values closest to zero indicating the highest expression score. ?Log10(p value) is represented by dot size, with increasing dot size indicating increasing significance. (D) Immunofluorescent staining for 2f11 and Nrp1 on WT and mpi+/mss14 adult zebrafish liver cryosections imaged at magnification �63. White arrows indicate representative bile ducts for each sample. (E) Violin plot for Nrp1 expression in Sox9+ cholangiocytes from scRNA-seq data on livers from control, BDL, and CCl4-treated mice. **p < 0.01, ***p < 0.001
|