Fig. 6
- ID
- ZDB-FIG-211118-62
- Publication
- Pradhan et al., 2021 - Satb2 acts as a gatekeeper for major developmental transitions during early vertebrate embryogenesis
- Other Figures
- All Figure Page
- Back to All Figure Page
|
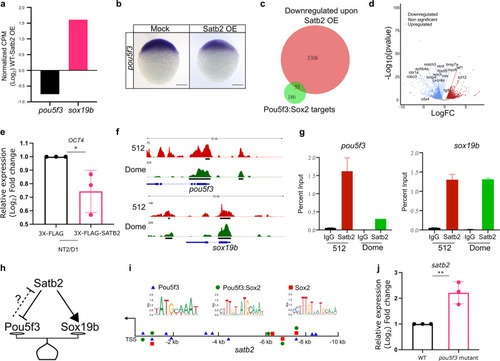
a Relative gene expression for pou5f3 and sox19b as determined by RNA-seq analysis (FDR < 0.05). b Lateral view of zebrafish embryo at 4 hpf for WISH using RNA probe against pou5f3 in control and Satb2 overexpressing embryos, n = 24, N = 3 biologically independent experiments Scale bar = 100 Ám. c Venn diagram analysis showing the overlap between negative targets of Satb2 and known genomic targets of Pou5f3 and Sox2. d Volcano plot of differentially expressed genes upon overexpression of Satb2 analyzed at 4.5 hpf. DE genes with FDR < 0.1 and log2 fold change > ▒0.58 are colored as red for upregulated, blue for downregulated, and gray for unchanged or non-significant genes. Key Pou5f3: Sox2 target genes are labeled. e Quantitative RT-PCR analysis of OCT4 (human homologue of pou5f3) expression in NT2/D1 cells upon overexpression of SATB2 as compared to FLAG overexpression. * Signifies P-value 0.049 as calculated by the unpaired Student?s two-tailed t-test, N = 3 biologically independent experiments. Error bar represents ▒SEM. f IGV snapshot of Satb2 ChIP-seq at 512 cells (red) and Dome stages (green) on genomic loci of pou5f3 and sox19b. g Quantitative relative enrichment (ChIP-qPCR) represented as percent input using isotype-matched IgG and anti-Satb2 antibody for genomic locus (TSS) of pou5f3 and sox19b. ** indicates P-value < 0.001 as calculated by the Student?s two-tailed t-test, N = 2. h The predictive regulatory model between maternal Satb2 and pioneer factors during the establishment of ZGA. i Schematic for satb2 promoter displaying motif sites marked for Pouf53, Pou5f3: Sox2 and Sox2. j qPCR analysis for satb2 expression at 4.5 hpf in pou5f3 mutant embryos. ** Signifies P-value < 0.0082 as calculated by the unpaired Student?s two-tailed t-test, N = 3 biologically independent experiments. Error bar represents ▒SEM. |

