Fig. 5
- ID
- ZDB-FIG-211118-61
- Publication
- Pradhan et al., 2021 - Satb2 acts as a gatekeeper for major developmental transitions during early vertebrate embryogenesis
- Other Figures
- All Figure Page
- Back to All Figure Page
|
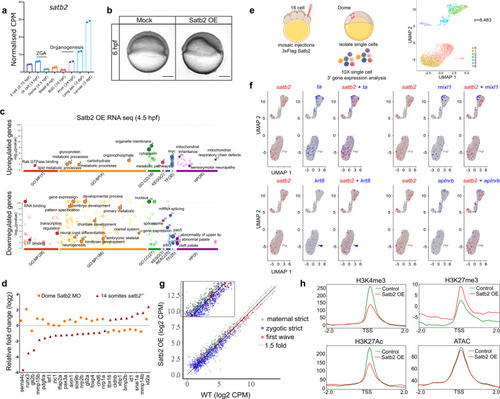
a Stage-specific gene expression analysis highlighting bi-phasic expression of Satb2 during MZT and organogenesis. Normalized CPM values for each stage are used for the analysis [GSE32900]. N = 2 biologically independent experiments. Error bar represents ±SD. b Lateral view of zebrafish embryos at 6 hpf injected with 200 pg eGFP (Mock) and 3xFlag-satb2 mRNA (Satb2 OE). Scale bar = 100 µm. N = 4 biologically independent experiments. c GO analysis for differentially expressed genes upon over-expression of Satb2 at 4.5 hpf. Significant ontologies under molecular function (MF), biological processes (BP), cellular components (CC), reactome (REAC), transcription factors (TF), and human pathology (HP) categories are highlighted. Numbers in brackets signify the total number of ontologies enriched under each category. d Relative expression values for genes involved in neural crest differentiation upon morpholino mediated depletion of maternal Satb2 (yellow circles) analyzed at 4.5 hpf and in zygotic satb2?/? mutants (red triangles) analyzed at 14 ss, highlighting opposite effects on gene regulation by maternal and zygotic forms of Satb2 (FDR < 0.1). e Experimental strategy for single-cell analysis of embryos with mosaic overexpression of Satb2 at 4.5 hpf. UMAP clustering illustrates eight different clusters based on gene expression patterns from 8483 single cells. f FeaturePlots for exemplifying negative correlation between cells expressing satb2 (blue) and zygotic factors ta, mixl1, krt8, and aplnrb (red). g Biplot depicting the effect of overexpression of Satb2 on maternal (green), zygotic (blue) and first wave zygotic genes (red). log2 CPM values are used for the analysis. The dotted line marks genes that show more than 1.5-fold differences in log2 CPM values. Inset is a zoomed version to highlight the differences. h Average mean density profiles around ±2 kb region around TSS of ?zygotic genes? for H3K4me3 (activation mark), H3K27me3 (repressive mark), H3K27Ac (activation mark) and ATAC-seq (chromatin accessibility) upon Satb2 overexpression (red) compared to control (green). |

