Fig. 1
- ID
- ZDB-FIG-211118-39
- Publication
- Pradhan et al., 2021 - Satb2 acts as a gatekeeper for major developmental transitions during early vertebrate embryogenesis
- Other Figures
- All Figure Page
- Back to All Figure Page
|
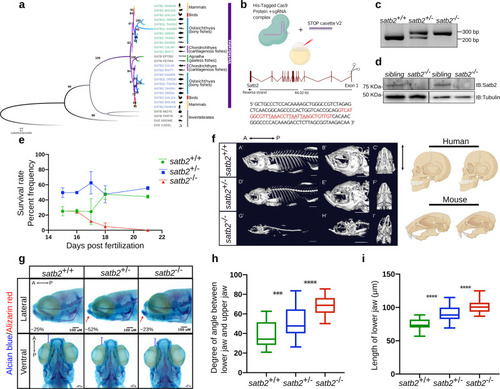
a Phylogenetic tree depicting evolution and divergence of SATB family proteins. SATB1 homologues are highlighted in green, SATB2 in blue whereas ancestors of SATB proteins are in gray. Organisms belonging to different classes are highlighted with different colors. Numbers on branching points represent bootstrap values. Organism labels: HUMAN- Homo sapiens, MOUSE- Mus musculus, GALGAL- Gallus gallus, ORENI- Oreochromis niloticus, TAKRU- Takifugu rubripes, DANRE- Danio rerio, CALMI- Callorhinchus milii, RHITY- Rhincodon typus, EPTBU- Eptatretus burger, PETMA- Petromyzon marinus, MIZYE- Mizuhopecten yessoensis, PARTE- Parasteatoda tepidariorum, DROME- Drosophila melanogaster and CAEEL- Caenorhabditis elegans. Additional copies of SATB1 and SATB2 were denoted with SATB1L (SATB1-like) and SATB2L (SATB2-like). b Schematic of CRISPR-Cas9 mediated mutant generation by introducing the STOP cassette (highlighted in red) in exon1 of the satb2 gene resulting in loss of function mutant allele. c Identification of mutant allele by genotyping (60 bp insertion). N = 5 independent biological experiments. d Confirmation of loss of Satb2 between siblings and homozygous larvae at 48 hpf by immunoblot. Tubulin was used as a loading control. N = 3 independent biological experiments. e Lifespan analysis of zygotic satb2 mutants depicted as a percentage frequency of individual genotype from a pool of larvae screened (incross of satb2+/−) by a line graph. Wild-type (green), Heterozygous (blue), and Homozygous mutants (Red). Error bar represents ±S.D. of two independent biological experiments with n = 48 larvae. f Micro CT images of adult zebrafish (4-month old) to visualize defects in skeletal and craniofacial structures. Lateral view A’, D’, G’, magnified lateral view B’, E’, H’ and ventral view C’, F’, I’ of wild type, heterozygous and mutant for Satb2 respectively are shown. Ventral view images are not scaled to attain a maximum field of view highlighting detailed structural deformities independent of the size of the fish. Image is a representative of N = 5 individual organisms. Scale bar = 5 mm. Corresponding schematics on the right depicting similarity with SATB2 mutation reported in humans and mice. g Alcian blue/Alizarin red staining to visualize craniofacial defects at early larval stages, 15 dpf. Abnormal jaw protrusion in heterozygous and homozygous mutants is indicated by a red arrow. Numbers in respective boxes signify the percentage of the larvae from the total population showing class of phenotype and genotype correlation. Scale bar = 100 µm. h Degrees of the angle between the lower jaw and upper jaw. *** indicates p-value = 0.002 and **** indicates p-value of significance 0.0001 as determined by the student’s two-tailed t-test. The whiskers show the minima to the maxima values and the central line indicates the median, satb2+/+, (n = 24) 38.04, satb2+/−, (n = 50) 52.14, satb2−/−, (n = 22) 68.57 over three independent biological experiments. i Total length of protrusion measured from ventral view as indicated in g, are plotted using a box plot. **** indicates p-value of significance 0.0001 as determined by the student’s two-tailed t-test. The whiskers show the minima to the maxima values and the central line indicates the median, satb2+/+, (n = 26) 74.68, satb2+/−, (n = 48) 90.25, satb2−/−, (n = 22) 102.0 over three independent biological experiments. |

