Fig. 3
- ID
- ZDB-FIG-211118-6
- Publication
- Pradhan et al., 2021 - Satb2 acts as a gatekeeper for major developmental transitions during early vertebrate embryogenesis
- Other Figures
- All Figure Page
- Back to All Figure Page
|
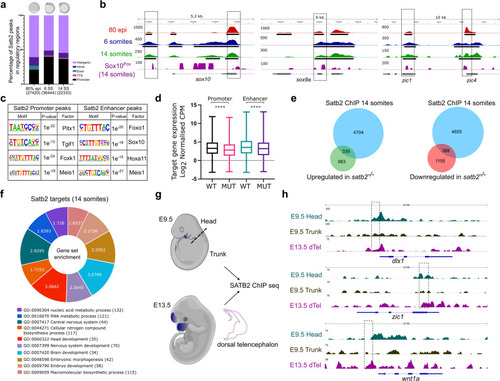
a Genome-wide distribution pattern of Satb2 occupancy in the regulatory regions. percentage of peaks overlapping with OCR at 80% epiboly, 6 ss, and 14 ss. Numbers in the brackets indicate the total number of Satb2 peaks at the corresponding developmental stage. Annotation was performed using HOMER, core promoter region was defined as ±2 kb from TSS. TTS, Exon, and Intron annotations were used from HOMER analysis. The remaining peaks were annotated as Intergenic peaks. b Integrative genomics viewer (IGV) snapshot of Satb2 occupancy on genomic loci of sox10, sox9a, and zic1 at 80 % epiboly (red), 6 ss (blue), 14 ss (green), and in Sox10Pos (purple) cells. Input subtracted tracks are used for visualization. For Satb2 ChIPseq in Sox10Pos (neural crest) cells, ChIPseq reads are normalized to signal from Sox10Neg (non-neural crest) cells to depict enrichment at respective gene loci. Solid line boxes highlight enriched genomic regions across all the datasets. Black colored blocks represent enriched regions determined by the peak calling algorithms. c Motif enrichment analysis for Satb2 binding sites at the promoter (±2 kb) and enhancer regions (overlapping with H3K4me1 binding sites) matched to known motif sets of danRer10 genome assembly. d Box plots indicating log2 normalized gene expression (Counts Per Million) of promoter- and enhancer- bound genes in wild-type and satb2?/? mutants at 14 ss. N = 2 biologically independent experiments. **** indicates p-value of significance 0.0001 as determined by the student?s two-tailed t-test. Error bar represents ±SEM. The whiskers show the minima to the maxima values and the central line indicates the median, WT promoter (n = 4178): 3.347, MUT promoter (n = 4149): 2.890, WT enhancer (n = 3337): 3.662, MUT enhancer (n = 3327): 3.281. e Venn analysis depicting the overlap between Satb2 bound genes and differentially regulated genes at 14 somites in the satb2?/? mutant. f GO analysis for biological processes of Satb2 occupied genes at 14 ss. Numbers for each category of doughnut plot represent enrichment ratio, FDR < 0.05. g Schematic of dissections performed for the ChIP-seq experiment in mouse embryos at E9.5 (head and trunk) and E13.5 (dorsal telencephalon). Dotted line represents the site of the incision. h, IGV snapshot of mouse SATB2 occupancy profile on the genomic loci of dlx1, zic1, and wnt1. Dashed line boxes highlight enriched regions in E9.5 head and E13.5 dTel which are absent in the E9.5 trunk region. |

