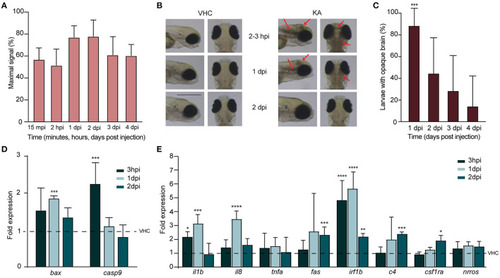
Injection of kainic acid in zebrafish larvae results in acute brain inflammation and apoptosis. (A) LC-MS/MS analysis of kainic acid (KA) levels in larval heads after injection of KA after 15 min post injection (mpi), 2 h post injection (hpi) and 1?4 days post injection (dpi) demonstrating stable levels of KA in zebrafish head tissues during each experimental timepoint. Maximal signal (%) refers to the highest signal found among measured samples. Data from four independent experiments are presented as mean � s.d. (B) Representative images of VHC- and KA-injected larvae at 2?3 hpi upon 2 dpi. Characteristic opaque brain tissue was noticeable after 2?3 hpi and persisted mainly until 1 dpi. Red arrows mark the brain lesions. Scale bar 500 ?m. (C) Quantification of larvae (%) with opaque brain at 1?4 dpi. All KA-injected larvae displayed opaque brain after 2?3 hpi (data not shown) and after 24 h still >80% of the larvae (***p < 0.001 compared to VHC determined immediately after injection [0%]) had this phenotype. Brain tissue cleared out during the following days. Means were pooled from three independent experiments, total number of larvae per condition: VHC n = 60, KA n = 84. Data are presented as mean � s.d. Statistical analysis was performed using ordinary one-way Anova with Bonferroni's multiple comparison test. (D,E) Quantification of the expression levels of apoptosis (D) and inflammatory (E) markers in the heads of KA-injected larvae at 3 hpi, 1 dpi and 2 dpi by qPCR. Data were presented as fold expression to VHC-injected larvae at the respective timepoints (dotted line). Data from three independent experiments are presented as mean � s.d. Statistical analysis was performed using ordinary one-way Anova with Bonferroni's multiple comparison test (*p < 0.05, **p < 0.01, ***p < 0.001, ****p < 0.0001 compared to VHC set to a 1-fold expression).
|
