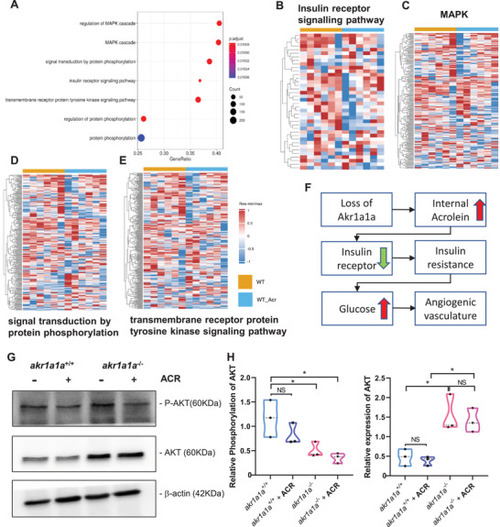
Down‐regulated insulin receptor signaling pathways in akr1a1a+/+ zebrafish larvae upon ACR treatment. A) Bubble plot showed the significantly down‐regulated biological pathways between akr1a1a+/+ and akr1a1a+/+ zebrafish larvae after ACR treatment at 5dpf via KEGG and GOBP analysis. Heatmaps showed relative mRNA expression in B) insulin receptor signaling pathways, C) MAPK, D) signal transduction by protein phosphorylation, and E) transmembrane receptor protein tyrosine kinase signaling pathway was down‐regulated significantly in akr1a1a+/+ zebrafish larvae after ACR treatment. Higher and lower expression is displayed in red and blue, respectively. F) Concise mechanism flow chart showed the consequence of defective ACR detoxification after Akr1a1a loss. G) Representative Western blot shows total AKT and phosphorylated AKT level in different groups. H) Quantification of AKT phosphorylation and total AKT expression in akr1a1a+/+ and akr1a1a−/− zebrafish larvae treated with ACR. GESA, gene set enrichment analysis. KEGG, Kyoto encyclopedia of gene and genomes. GOBP, gene ontology biological processes. For statistical analysis one‐way ANOVA followed by Tukey's multiple comparisons test was applied. *p < 0.05. NS, not significant.
|
