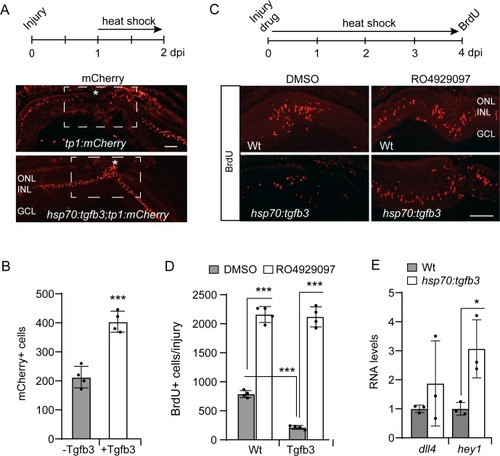
(A) Top illustration is experimental time line. Bottom panels show mCherry immunofluorescence on retinal sections from either injured tp1:mCherry or hsp70:tgfb3;tp1:mCherry transgenic fish. Asterisk and box region shows the injury site. Note forced Tgfb3 expression stimulate mCherry expression. (B) Quantification of data mCherry+ cells shown in (A). (C) Top is experimental time line. Bottom panels show BrdU immunofluorescence on retinal sections from injured and heat shock-treated Wt and hsp70:tgfb3 fish treated +/- RO4929097. (D) Quantification of data in (C). (E) qPCR analysis of dll4 and hey1 RNA expression using total retinal RNA from Wt and hsp70:tgfb3 fish that were given a 1 hr heat shock (HS) treatment before sacrifice. Values are normalized to Wt control. Error bars are SD. *p<0.05, ***p<0.001. Scale bar is 50 microns.