
Figure 5
- ID
- ZDB-FIG-200318-14
- Publication
- Weinberger et al., 2020 - Functional Heterogeneity within the Developing Zebrafish Epicardium
- Other Figures
- All Figure Page
- Back to All Figure Page
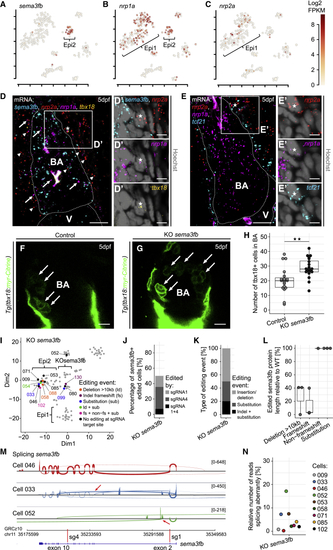
(A–C) Expression of (D) mRNA staining of (E) mRNA staining of (F) The BA in a 5 dpf control larva. (G) Increased numbers of (H) Absolute quantification of (I–N) Analysis of gene editing in single Scale bars: 10 μm in (D)–(G) and 5 μm in (D′) and (E′). Color channels were adjusted separately for brightness and contrast. (D)–(G) are single optical sections. Data in (H) and (L) are represented as median, first, and third quartiles (box). Significance calculated using Welch’s t test. ∗∗p < 0.01. V, ventricle; BA, bulbus arteriosus. See also |
| Genes: | |
|---|---|
| Fish: | |
| Knockdown Reagents: | |
| Anatomical Term: | |
| Stage: | Day 5 |
| Fish: | |
|---|---|
| Knockdown Reagents: | |
| Observed In: | |
| Stage: | Day 5 |
Reprinted from Developmental Cell, 52(5), Weinberger, M., Sim�es, F.C., Patient, R., Sauka-Spengler, T., Riley, P.R., Functional Heterogeneity within the Developing Zebrafish Epicardium, 574-590.e6, Copyright (2020) with permission from Elsevier. Full text @ Dev. Cell