|
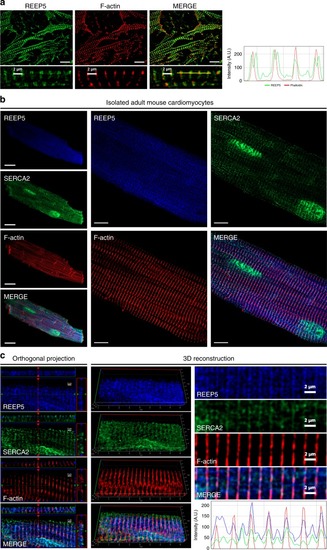
REEP5 expression shows consistent SR staining pattern in cardiac myocytes.a Immunofluorescence analysis of endogenous REEP5 expression (green) and phalloidin-rhodamine staining (red) in CMNCs. Right panel, line-scan analysis (from yellow line) demonstrates SR expression pattern in CMNCs. Scale, 10 μm. b Immunofluorescence of isolated adult mouse cardiac myocytes with REEP5 (blue) co-stained with SERCA2 (green) and phalloidin-rhodamine (red). Scale, 20 μm (left panel), 10 μm (right panel). c Orthogonal projection, three-dimensional reconstructive and line-scan analyses demonstrates co-localization between REEP5, SERCA2, and phalloidin signal. (Left panel): the top panels represent cell imaging in the x–z plane, while side panels represent cell imaging in the y–z plane. All images shown are representative of approximately 40–50 total images captured per condition, n = 3 independent biological replicates.
|