
Figure 3.
- ID
- ZDB-FIG-200210-18
- Publication
- Chhabria et al., 2018 - The effect of hyperglycemia on neurovascular coupling and cerebrovascular patterning in zebrafish
- Other Figures
- All Figure Page
- Back to All Figure Page
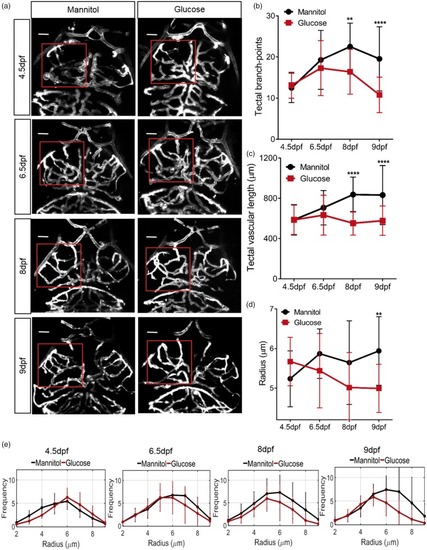
Effect of glucose exposure on cerebrovascular patterning in zebrafish. (a) Representative micrographs of cerebral vessels exposed to 20 mM mannitol or glucose from 4 dpf for 12 h, 60 h, 96 h and 120 h. Square indicates region of left optic tectum quantified in (b)–(e). (b) Number of tectal vessel branchpoints ( |
| Fish: | |
|---|---|
| Condition: | |
| Observed In: | |
| Stage: | Days 7-13 |