FIGURE SUMMARY
Title

The effect of hyperglycemia on neurovascular coupling and cerebrovascular patterning in zebrafish

Authors
Chhabria, K., Plant, K., Bandmann, O., Wilkinson, R.N., Martin, C., Kugler, E., Armitage, P.A., Santoscoy, P.L., Cunliffe, V.T., Huisken, J., McGown, A., Ramesh, T., Chico, T.J., Howarth, C.
Source
Full text @ J. Cereb. Blood Flow Metab.

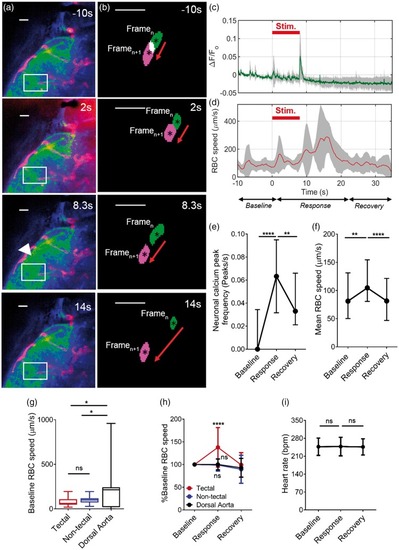
8 dpf zebrafish larvae display neurovascular coupling. (a) The left optic tectum of an 8 dpf Tg(nbt:GCaMP3; kdrl:mCherry;gata1:DsRED) embryo before (−10 s), during (2 s and 8.3 s) and after (14 s) visual stimulus by red light. Arrow indicates area of increased tectal calcium levels in response to the stimulus. (b) Segmented RBCs shown for two consecutive frames (Framen and Framen+1) for corresponding time point of the neuronal responses shown in (a). Individual RBCs are labelled in green to represent Framen and magenta to represent Framen+1. (c) Quantification of neuronal activation (ΔF/Fo) in optic tectum over time (n = 5 larvae). Visual stimulus was administered 0–8 s (indicated on graph). Timeseries was divided into baseline (−10 – 0 s), response (0–20 s), and recovery (20–30 s) periods. (d) Erythrocyte (RBC) speed in tectal vessels in the same animals as (c). (e) Quantification of frequency of peaks in (ΔF/Fo) as a measure of neuronal activation during baseline, response and recovery time periods (n = 40 larvae). (f) Mean RBC speed in the tectal vessels during baseline, response and recovery time periods in the same animals as (e). (g) Baseline RBC speed in tectal vessels, non-tectal (hindbrain and forebrain) vessels and dorsal aorta. (h) RBC speed expressed as percentage from the baseline for baseline, response and recovery for tectal vessels, non-tectal vessels and dorsal aorta (n = 17 larvae/group). (i) Beating heart rate (bpm) quantified for baseline, response and recovery time periods (n = 9 larvae/group). *p < 0.05, **p < 0.01, ****p < 0.0001. Scale bar represents 20 µm. Data in (e) and (f) are median and interquartile range (25% and 75% percentile). All other data are mean ± s.d.

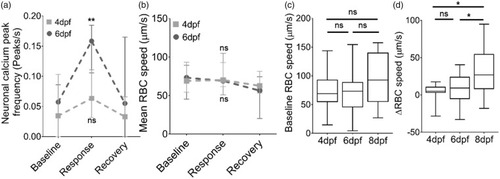
Neurovascular coupling in zebrafish develops after 6 dpf. (a) Quantification of frequency of peaks in (ΔF/Fo) as a measure of neuronal activation during the baseline, response and recovery time periods for 4dpf and 6dpf (n = 17 larvae/group). (b) Mean RBC speed during baseline, response and recovery time periods in the same animals as (a) (n = 17 larvae/group). (c) Mean baseline RBC speed in tectal vessels in 4, 6 and 8 dpf zebrafish. (d) Change in RBC speed (ΔRBC) in response to stimulus in 4, 6, and 8 dpf (n = 17 larvae/group). *p < 0.05, **p < 0.01. Data in (a) and (b) are mean ± s.d.

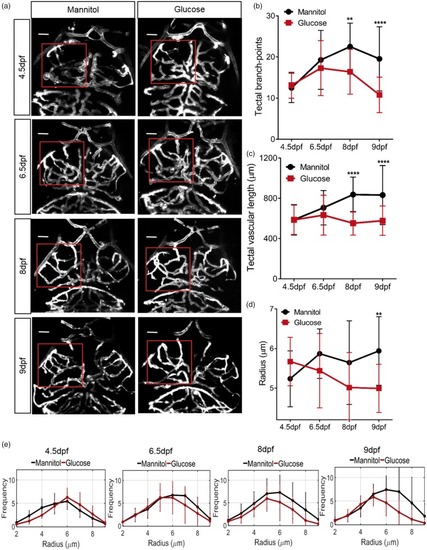
Effect of glucose exposure on cerebrovascular patterning in zebrafish. (a) Representative micrographs of cerebral vessels exposed to 20 mM mannitol or glucose from 4 dpf for 12 h, 60 h, 96 h and 120 h. Square indicates region of left optic tectum quantified in (b)–(e). (b) Number of tectal vessel branchpoints (n = 17, 16, 15 and 20 larvae for 12 h, 60 h, 96 h and 120 h exposure, respectively). (c) Total tectal vessel length in same animals as (b). (d) Mean tectal vessel radius in same animals as in (b). (e) Histograms of tectal vessel radii of tectal vessels in same animals as in (b). Scale bar represents 20 µm. Data are mean ± s.d.

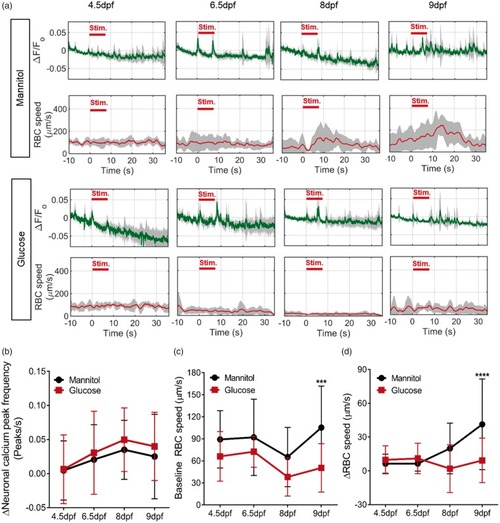
Effect of glucose exposure on neurovascular function in zebrafish. (a) Time series of neuronal activation (ΔF/Fo) and tectal vessel RBC speed in zebrafish exposed to 20 mM mannitol or glucose from 4 dpf for 12 h, 60 h, 96 h and 120 h (n = 5 larvae/group). (b) Change in neuronal calcium peak frequency in the left optic tectum during response compared to baseline periods (n = 17, 17, 15 and 20 for 12 h, 60 h, 96 h and 120 h exposure, respectively). (c) Baseline RBC speed at the same time points in (b) and (c). (d) Change in RBC speed (ΔRBC) between baseline and response time periods for the same animals as (b). ***p < 0.005, ****p < 0.0001. Data are mean ± s.d.

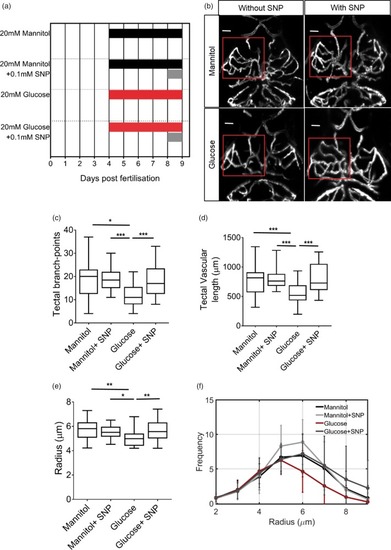
Sodium nitroprusside reverses the effect of glucose exposure on cerebrovascular patterning. (a) Gannt chart indicating treatment groups and duration of drugs exposures for experiments in Figures 6 and 7. (b) Representative micrographs of cerebral vessels of 9 dpf Tg(kdrl:mCherry) larvae exposed to mannitol or glucose ± SNP. (c) Quantification of number of tectal vascular branch points in all groups (n = 23 larvae/group). (d) Quantification of total tectal vessel length in same animals as in (c). (e) Mean tectal vessel radius for the same animals as in (c) (n = 23 larvae/group). (f) Histogram of radii of vessels in the left optic tectum in the same animals as in (c). Scale bar represents 20 µm. *p < 0.05, **p < 0.01, ***p < 0.005. Scale bar represents 20 µm. Data in (f) are mean ± s.d.

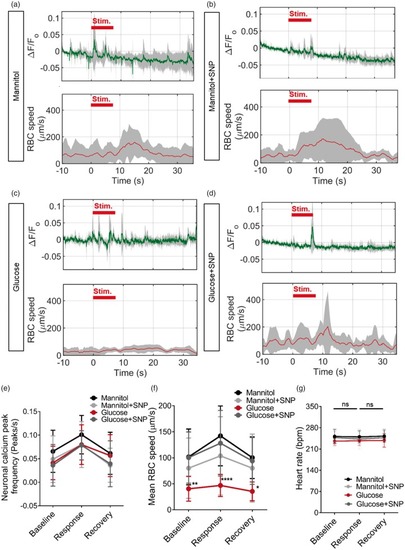
Sodium nitroprusside reverses the effect of glucose on neurovascular coupling. (a)–(d) Time series of neuronal activation (ΔF/Fo) and tectal vessel RBC speed in zebrafish (5 larvae/group) exposed to: (a) 20 mM mannitol for 120 h from 4 to 9 dpf. (b) 20 mM mannitol for 120 h from 4 to 9 dpf and 0.1 mM SNP for 24 h from 8 to 9 dpf. (c) 20 mM glucose for 120 h from 4 to 9 dpf. (d) 20 mM glucose for 120 h from 4 to 9 dpf and 0.1 mM SNP for 24 h from 8 to 9 dpf. (e) Frequency of peaks of neuronal activation during baseline, response and recovery time periods in mannitol or glucose exposed larvae with or without co-treatment with 0.1 mM SNP (n = 20 larvae/group). (f) RBC speed for baseline, response and recovery for same animals in (e). (g) Beating heart rate (bpm) quantified for baseline, response and recovery time periods for larvae exposed to 20 mM mannitol, 20 mM glucose with or without SNP treatment. *p < 0.05, **p < 0.01, ***p < 0.001, ****p < 0.0001. Data are mean ± s.d.

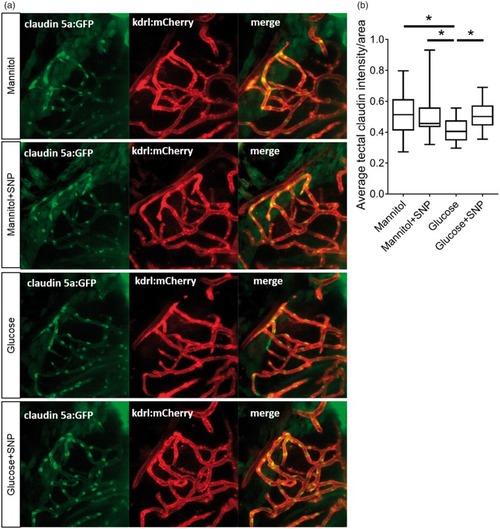
Claudin 5a:GFP expression in tectal vessels in zebrafish larvae treatment with mannitol or glucose with or without SNP. (a) Representative micrographs of Tg(claudin5a:GFP;kdrl:mCherry) exposed to 20 mM mannitol for five days or 20 mM glucose for five days with or without SNP (one day treatment) imaged at 9 dpf. (b) Quantification of mean GFP fluorescence in the tectal vessels (n = 23, 19, 24 and 19 larvae for mannitol, mannitol+SNP, glucose and glucose+SNP-treated larvae, respectively).

Acknowledgments
This image is the copyrighted work of the attributed author or publisher, and ZFIN has permission only to display this image to its users. Additional permissions should be obtained from the applicable author or publisher of the image. Full text @ J. Cereb. Blood Flow Metab.