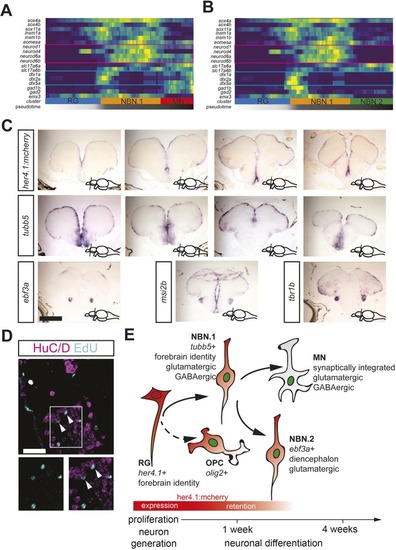
The NBN clusters show diversity in cell fate determinant expression and anatomical localization in the adult forebrain. (A,B) Heatmaps showing gene expression dynamics of proliferation markers, Notch targets, neurogenic fate determinants, telencephalic identity markers and neuronal subtype markers along the differentiation trajectory from RG to MNs (A) or from RG to NBN.2 cells (B). Genes (rows) are clustered and cells (columns) are ordered according to the pseudotime development. Magenta and turquoise frames mark identity markers for dorsal or ventral telencephalon, respectively. (C) In situ hybridization for mcherry in her4.1:mcherry reporter fish (top), the NBN.1 marker tubb5 (middle), and the NBN.2 markers ebf3a, msi2b and tbr1b (bottom) in wild-type fish. There is consistent expression of NBN.2 markers in the lateral diencephalon. The rostrocaudal level of the section is indicated in the bottom right corner. (D) Optical section of immunostaining for the neuronal markers HuC/D (magenta) and EdU labeling (turquoise) in the vENT, indicating the localization of NBNs (arrowheads). (E) Schematic representation of the resulting model from this study. Scale bars: 200 µm in C; 20 µm in D.
|