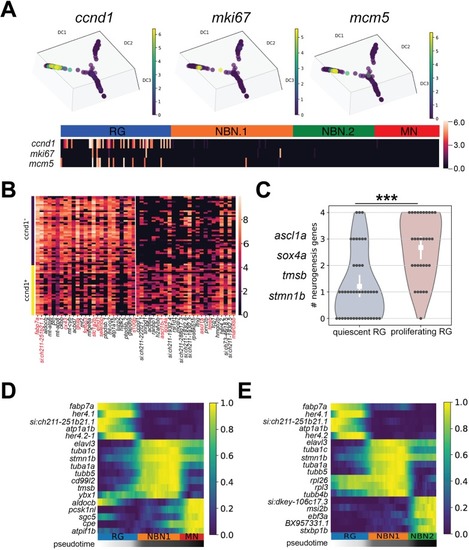
Proliferation is confined to radial glia and is associated with neurogenic commitment. (A) Expression pattern of the proliferation markers ccnd1 (left), mki67 (middle) and mcm5 (right) along the trajectory path of RG differentiation. A heatmap indicating the co-expression of these genes in RG is shown at the bottom. (B) Heatmap showing differentially expressed genes in ccnd1− quiescent RG and ccnd1+ proliferating RG. There is enrichment of classical RG markers in quiescent RG (left, red gene symbols), and of neurogenic fate determinants and NBN.1 marker genes in proliferating RG (right, red gene symbols). (C) Violin plot showing cumulative expression of the four most widely expressed neurogenic fate determinants and neuronal genes (left) in quiescent (gray) and proliferating (red) RG. Dots represent cells expressing the indicated number of genes. n=45 (quiescent) or 31 (proliferating). ***P<0.001 using a Mann-Whitney U-test. (D,E) Heatmaps showing gene expression dynamics of differentially expressed genes along the differentiation trajectory from RG to MNs (D) or from RG to NBN.2 cells (E). Genes (rows) are clustered and cells (columns) are ordered according to the pseudotime development. There is specific expression of tubb5 in the NBN.1 and of ebf3a and msi2b in the NBN.2 cluster.
|