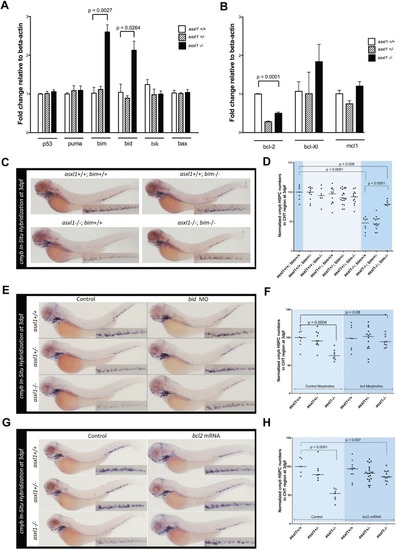
Overexpression of bim and bid mediates apoptosis in asxl1−/−HSPCs. (A,B) Quantitative PCR was performed with cDNA isolated from the trunks of 48 hpf asxl1+/+, asxl1+/− and asxl1−/− zebrafish embryos to quantify the expression of pro-apoptotic (A) and anti-apoptotic (B) members of the Bcl2 family. Expression levels are shown relative to β-actin. The values are means of triplicate runs with s.e.m. Statistical significance was determined with unpaired Student's t-test. Results from a single experiment are shown; however, four independent experiments were performed for both panels A and B with similar results. (C) WISH to detect cmyb with the indicated genotypes at 3 dpf, showing that the loss of HSPCs in asxl1−/− fish is rescued by loss of bim. (D) Cropped CHT regions from panel C were quantified with use of 98 embryos per genotype with ImageJ software. (E) WISH to detect cmyb was performed at 3 dpf for embryos with the indicated genotypes that were injected with 16 ng of either bid morpholino or control morpholino, showing that the loss of HSPCs in asxl1−/− fish is rescued by loss of bid. (F) Cropped CHT regions from panel E were quantified with use of 60 embryos per genotype and ImageJ software. (G) WISH to detect cmyb was performed at 3 dpf for embryos with the indicated genotypes that were injected with 100 ng/µl mRNA encoding either Bcl2 or GFP. Overexpression of bcl2 rescued the loss of HSPCs in asxl1−/− fish. (H) Cropped CHT regions from panel G were quantified with use of 70 embryos per genotype and ImageJ software. In panels D, F and H, black bars representing the median values. Statistical analysis was done with Prism software. Unpaired Student's t-tests were performed in Prism software to determine the P-value for each genotype group compared to controls.
|
