
Fig. 4
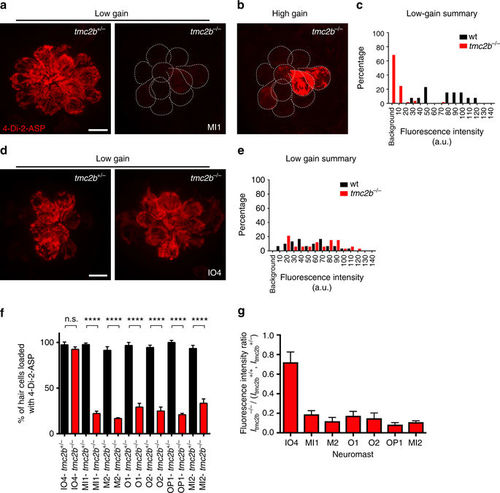
Spatial positioning of anterior neuromasts regulates diverse Tmc2b dependence. a Confocal micrographs of MI1 hair cells incubated with 4-Di-2-ASP from tmc2b +/? (left) or tmc2b ?/? (right) animals at 6?dpf, viewed under low gain. b Hair cells from a, right, viewed under high gain. c Percentages of MI1 hair cells at different fluorescence intensities (n?=?5). d Images and e percentages of hair cells at different fluorescence intensities from IO4 neuromasts (n?=?5). f Percentages of hair cells of ALL neuromasts that take up 4-Di-2-ASP. ****One-way ANOVA with Holm-Sidak?s multiple comparisons test P? <?0.0001. n values (het/homo): IO4?=?6/4, MI1?=?7/5, M2?=?5/3, O1?=?5/2, O2?=?5/4, OP1?=?5/3, MI2?=?5/5. g Mean whole-neuromasts normalized fluorescence intensity ratios, I tmc2b ?/?/ (I tmc2b +/+, I tmc2b +/?). n values???5. Scale bar?=?6?�m |