
Fig. s3
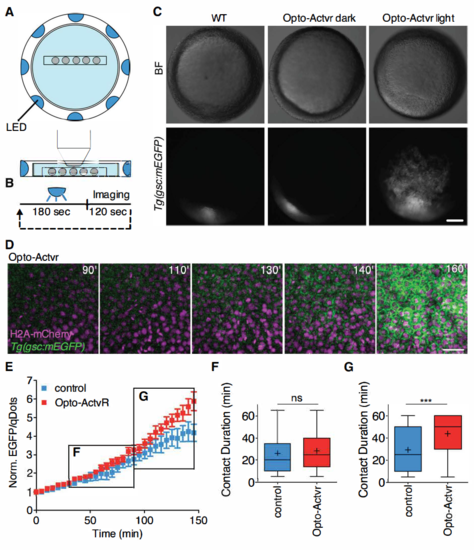
Light activation of Opto-Actvr expressing ppl progenitor cells. Related to Figure 4. (A) Schematic representation of the LED illumination system coupled to a multi-photon imaging setup. (B) LED illumination was remotely controlled. The sample was exposed to LED light for 180 sec, followed by multi-photon imaging for 120 sec. These cycles were repeated for a period of 160 min. (C) Stereoscope images of Tg(gsc::mEGFP) embryos ubiquitously expressing Opto-Actvr. WT Tg(gsc::mEGFP) or Tg(gsc::mEGFP) embryos injected with mRNA encoding for Opto-Actvr were imaged from sphere stage (3 hpf) to shield stage (6 hpf) with a multi-photon microscope coupled to a LED illumination system. Control Tg(gsc::mEGFP) embryos injected with mRNA encoding for Opto-Actvr were kept in a light tight box for the duration of the experiment (Opto-Actvr dark). Images were taken at shield stage (6 hpf). Scale bar, 100 ?m. (D) Representative images of a time-lapse recording of a Tg(gsc::mEGFP) embryo ubiquitously expressing Opto-Actvr and H2A-mCherry. Images were taken between sphere stage (3 hpf) and shield stage (6 hpf) with alternating LED illumination and multi-photon imaging. Animal pole views with cells ectopically expressing gsc::mEGFP. Scale bar, 40 ?m (E) gsc::EGFP expression in ppl cells transplanted from Tg(gsc::mEGFP) embryos injected with mRNA encoding for a chemically-activated form of Actvr1 together with qDots and dextran-cascadeblue (control cells) or mRNA encoding for a light-activated form of Actvr1 together with qDtos (Opto-Actvr1 cells) into similar staged WT Tg(gsc::mEGFP) host embryos. Transplantation was performed at shield stage (6 hpf) and images were taken between 60% epiboly stage (6.5 hpf) and 90% epiboly stage (9hpf). Average EGFP/qDots ratios were computed for each cell, normalized on the first imaging time point and plotted as a function of time. n (control cells), 14; n (Opto-Actvr1 cells), 13; 2 independent experiments. (F-G) Cell-cell contact persistence in transplanted ppl cells. Ppl progenitor cells were transplanted from Tg(gsc::mEGFP) embryos injected with either mRNA encoding for a chemically-activated form of Actvr1 together with qDots and dextran-cascadeblue (control cells) or mRNA encoding for a light-activated form of Actvr1 together with qDtos (Opto-Actvr1 cells) into similar staged WT Tg(gsc::mEGFP) embryos. Transplantation was performed at shield stage (6 hpf) and images were taken between 60% epiboly stage (6.5 hpf) and 90% epiboly stage (9hpf). (F) Cell-cell contacts formed between transplanted ppl donor cells and host cells were tracked between 65% epiboly stage (7 hpf) and 80% epiboly (8 hpf) stages. Values are shown as Tukey box-and-whiskers plots with median (bar) and average (cross) values. n (control), 173; n (Opto-Actvr), 146; 2 independent experiments. (G) Cell-cell contacts formed between transplanted ppl donor cells and host cells were tracked between 80% epiboly (8hpf) and 90% epiboly stages (9 hpf). Values are shown as Tukey box-and-whiskers plots with median (bar) and average (cross) values. n (control), 159; n (Opto-Actvr), 113; 2 independent experiments. Statistical test, Mann Whitney t-tes; P values, ***< 0.001, ns = not significant. |
Reprinted from Developmental Cell, 43(2), Barone, V., Lang, M., Krens, S.F.G., Pradhan, S.J., Shamipour, S., Sako, K., Sikora, M., Guet, C.C., Heisenberg, C.P., An Effective Feedback Loop between Cell-Cell Contact Duration and Morphogen Signaling Determines Cell Fate, 198-211.e12, Copyright (2017) with permission from Elsevier. Full text @ Dev. Cell