
Fig. 4
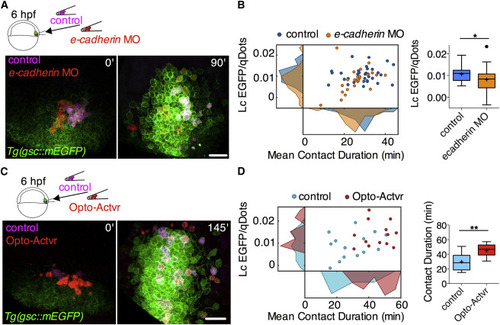
Mutual Enhancement between Prechordal Plate Cell-Cell Contact Formation and Nodal Signaling In Vivo (A) Representative multi-photon images of ppl cells transplanted from Tg(gsc::mEGFP) embryos injected with either control MOs, qDots, and dextran-Cascade Blue (control cells), or e-cadherin MOs and qDots (e-cadherin morphant cells) into similar staged WT Tg(gsc::mEGFP) embryos. Transplantation was performed at shield stage (6 hpf) and images were taken between 65% epiboly stage (7 hpf) and 75% epiboly stage (8 hpf). Scale bar, 50 ?m. (B) Linear coefficient (Lc) of gsc::mEGFP/qDots increase as a function of mean contact duration for transplanted control and e-cadherin morphant cells between 7 and 8 hpf. Frequency distributions of linear coefficients and mean contact durations are shown on the respective axes. Lc values are also shown as Tukey box-and-whisker plots. n (control cells), 33; n (e-cadherin morphant cells) 24; 2 independent experiments. Statistical test, Student t test, two tailed. ?p < 0.05. (C) Representative multi-photon images of ppl cells transplanted from Tg(gsc::mEGFP) embryos injected with either mRNA encoding for a chemically activated form of Actvr1, qDots, and dextran-Cascade blue (control cells) or mRNA encoding for a light-activated form of Actvr1 and qDots (Opto-Actvr1 cells) into similar staged WT Tg(gsc::mEGFP) embryos. Transplantation was performed at shield stage (6 hpf), and images were taken between 75% epiboly stage (8 hpf) and 90% epiboly stage (9 hpf). Scale bar, 50 ?m. See also Figure S3. (D) Linear coefficient (Lc) of gsc::mEGFP/qDots increase as a function of mean contact duration for transplanted control and Opto-Actvr1-expressing cells between 8 and 9 hpf. Frequency distributions of linear coefficients and mean contact durations are shown on the respective axes. Mean contact durations are also shown as Tukey box-and-whisker plots. n (control cells), 14; n (Opto-Actvr1 cells), 13; 2 independent experiments. Statistical test, Student t test, two tailed. ??p < 0.01. Note that the absolute values of Lc may differ from Figures 1Figures 1E and 1F as a later temporal window has been analyzed in these experimental sets. |
Reprinted from Developmental Cell, 43(2), Barone, V., Lang, M., Krens, S.F.G., Pradhan, S.J., Shamipour, S., Sako, K., Sikora, M., Guet, C.C., Heisenberg, C.P., An Effective Feedback Loop between Cell-Cell Contact Duration and Morphogen Signaling Determines Cell Fate, 198-211.e12, Copyright (2017) with permission from Elsevier. Full text @ Dev. Cell