
Fig. 2
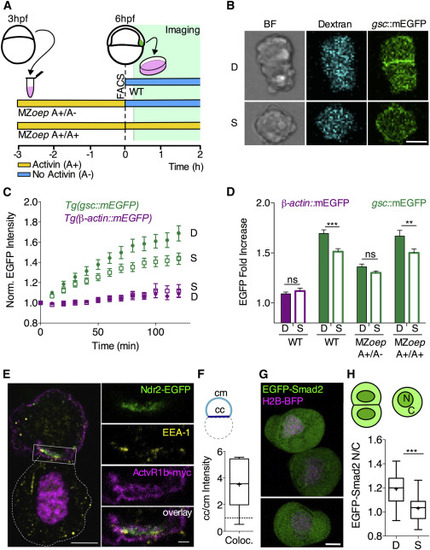
Prechordal Plate Cell-Cell Contact Formation Promotes Nodal Signaling In Vitro (A) Schematic representation of the experimental design. Gsc::mEGFP positive cells were isolated via FACS from WT Tg(gsc::mEGFP) embryos injected with fluorescent dextran-Alexa648 at shield stage (6 hpf) and seeded on non-adhesive substrates for subsequent imaging. MZoep;Tg(gsc::mEGFP) embryos injected with dextran-Alexa648 were dissociated at 3 hpf, and cells were exposed to Activin for 3 hr in culture. Activin-induced Gsc::mEGFP positive cells were then selected by FACS and seeded on non-adhesive substrates for subsequent imaging. During imaging, selected cells were kept in culture medium either containing Activin (MZoep A+/A+) or not (MZoep A+/A-). (B) Representative images of doublets (D) and single cells (S) obtained from WT Tg(gsc::mEGFP) at shield stage (6 hpf) after 160 min in culture. Scale bar, 10 μm. (C) Fold increase of average gsc::mEGFP intensities in single cells (S) versus cell doublets (D) as a function of time in culture for ppl cells isolated from Tg(gsc::mEGFP) or Tg(gsc::tRFP);Tg(β-actin::mEGFP) at shield stage (6 hpf). Plotted values, mean ± 95% CI. n (gsc::mEGFP, single cells), 41; n (gsc::mEGFP, doublets), 40; 5 independent experiments. n (β-actin::mEGFP, single cells), 18; n (β-actin::mEGFP, doublets), 19; 5 independent experiments. (D) Average gsc::mEGFP fold increase for doublets (D) and single (S) ppl cells taken from WT or MZoep;Tg(gsc::mEGFP) embryos at shield stage (6 hpf) and cultured for 120 min in the presence (A+/A+) or absence (A+/A–) of Activin within the culture medium. Plotted values, mean ± SEM. n (β-actin::mEGFP, single cells), 18; n (β-actin::mEGFP, doublets), 19; 5 independent experiments. n (gsc::mEGFP, single cells), 52; n (gsc::mEGFP, doublets), 42; 5 independent experiments. n (MZoep, gsc::mEGFP, (A+/A−), single cells), 52; n (MZoep, gsc::mEGFP, (A+/A−), doublets), 47; n (MZoep, gsc::mEGFP, (A+/A+), single cells), 36; n (MZoep, gsc::mEGFP, (A+/A+), doublets), 36; 7 independent experiments. Statistical test, two-way ANOVA and Bonferroni post test; ∗∗p < 0.005; ∗∗∗p < 0.001; ns, not significant. (E) Confocal image of a ppl cell doublet isolated from embryos overexpressing Ndr2EGFP and ActvR1b-myc at 6 hpf and kept in culture for 60 min, showing the subcellular localization of Ndr2-EGFP relative to ActvR1b-myc and EEA1 visualized by immunohistochemistry in the top cell. The bottom cell (outlined by white dashed line) only expresses H2A-Cherry to mark its nucleus. Scale bar, 5 μm. Inset shows high magnification of the colocalization between EEA1, Ndr2-EGFP, and ActvR1b-myc at the cell-cell contact. Scale bar, 1 μm. (F) Intensity ratios of colocalizing EEA1, Ndr2-EGFP, and Actvr1b-myc at cell-cell (cc) versus cell-medium (cm) interfaces of ppl cell doublets obtained from embryos at 6 hpf and kept in culture for 60 min. Values are shown as Tukey box-and-whisker plots with median (bar) and average values (cross). n (doublets), 6; 2 independent experiments. (G) Representative images of ppl cells isolated from Tg(gsc::tRFP) embryos at shield stage (6 hpf) expressing EGFP-Smad2 and H2B-BFP after 60 min in culture. Scale bar, 5 μm. (H) EGFP-Smad2 nuclear-to-cytoplasmic (N/C) ratios for ppl cell doublets (D) and single cells (S) taken from WT Tg(gsc::tRFP) embryos expressing EGFP-Smad2 and H2B-BFP after 60 min in culture. Values are shown as Tukey box-and-whisker plots with median (bar) and average values (cross). n (single cells), 27; n (doublets), 22; 3 independent experiments. Statistical test, Student t test, two tailed; ∗∗∗p < 0.001. See also Figure S2 and Movie S2. |
Reprinted from Developmental Cell, 43(2), Barone, V., Lang, M., Krens, S.F.G., Pradhan, S.J., Shamipour, S., Sako, K., Sikora, M., Guet, C.C., Heisenberg, C.P., An Effective Feedback Loop between Cell-Cell Contact Duration and Morphogen Signaling Determines Cell Fate, 198-211.e12, Copyright (2017) with permission from Elsevier. Full text @ Dev. Cell