
Fig. s2
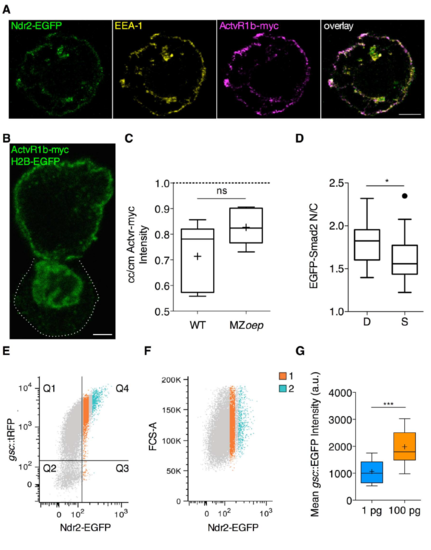
Localization of Nodal signaling pathway components in ppl cells in vitro and FACS sorting strategy for Ndr2-EGFP expressing cells. Related to Figure 2 and 3. (A) Confocal image of a ppl single cell isolated from embryos over-expressing Ndr2-EGFP and ActvR1b-myc at 6 hpf and kept in culture for 60 min, showing uniform subcellular localization of Ndr2-EGFP relative to ActvR1b-myc and EEA1 visualized by immunohistochemistry. Scale bar, 5 μm. (B) Confocal image of a ppl cell doublet isolated from MZoep embryos over-expressing ActvR1b-myc at 3 hpf, exposed to Activin and kept in culture for 60 min after FACS sorting, showing of ActvR1b-myc visualized by immunohistochemistry in the top cell. The bottom cell (outlined by white dashed line) only expresses H2B-EGFP to mark its nucleus. Scale bar, 5 μm. (C) Intensity ratios of Actvr1b-myc on the plasma membrane at cell-cell (cc) versus cell-medium (cm) interfaces of ppl cell doublets obtained from WT embryos and MZoep embryos and kept in culture for 60 min. Values are shown as Tukey box-and-whiskers plots with median (bar) and average values (cross). n (WT), 6; n(MZoep), 6; 2 independent experiments each. (D) EGFP-Smad2 nuclear-to-cytoplasmic (N/C) ratios for cell doublets (D) and single cells (S) taken from MZoep embryos expressing EGFP-Smad2 and H2B-BFP after exposure to Activin for 3h and kept in culture in the presence of Activin for 60 min after FACS isolation (equivalent to MZoep A+/A+ condition in Figure 2D). Values are shown as Tukey box-and-whiskers plots with median (bar) and average values (cross). n (single cells), 21; n (doublets), 14; 2 independent experiments. Statistical test, Student t test, two tailed; P values,*< 0.05. (E) FACS sorting strategy: mesendoderm (ppl) cells were obtained from 6 hpf Tg(gsc::tRFP) embryos injected with ndr2-GFP mRNA (100 pg/embryo) at the one-cell stage and sorted into 2 groups according to their Ndr2-EGFP expression levels. The scatter plot shows the correlation between gsc::tRFP and Ndr2-EGFP signal. Cells in Q4 are positive for both signals. FACS recording for one representative experiment. (F) Cell size control: the forward scattering signal (FCS-A) shows there is no cell size difference between cells expressing low (1) and high (2) levels of Ndr2-EGFP. FACS recording for one representative experiment. (G) Mean EGFP intensity of mesendoderm progenitor cells isolated from Tg(gsc::mEGFP) expressing either low (1 pg) or high (100 pg) levels of ndr2 mRNA and transplanted in the animal pole of host embryos at 6 hpf. Mean EGFP intensity was measured 120 minutes after transplantation at 75% epiboly stage (8 hpf). Values are shown as Tukey box-and-whiskers plots with median (bar) and average values (cross). n (1 pg), 27; n (100 pg), 26; 2 independent experiments each. Statistical test, Mann Whitney t test, two tailed. P value: ***<0.001. See also Figure 2 and 3. |
Reprinted from Developmental Cell, 43(2), Barone, V., Lang, M., Krens, S.F.G., Pradhan, S.J., Shamipour, S., Sako, K., Sikora, M., Guet, C.C., Heisenberg, C.P., An Effective Feedback Loop between Cell-Cell Contact Duration and Morphogen Signaling Determines Cell Fate, 198-211.e12, Copyright (2017) with permission from Elsevier. Full text @ Dev. Cell