
Fig. 1
- ID
- ZDB-FIG-160414-17
- Publication
- Mishima et al., 2016 - Codon Usage and 3' UTR Length Determine Maternal mRNA Stability in Zebrafish
- Other Figures
- All Figure Page
- Back to All Figure Page
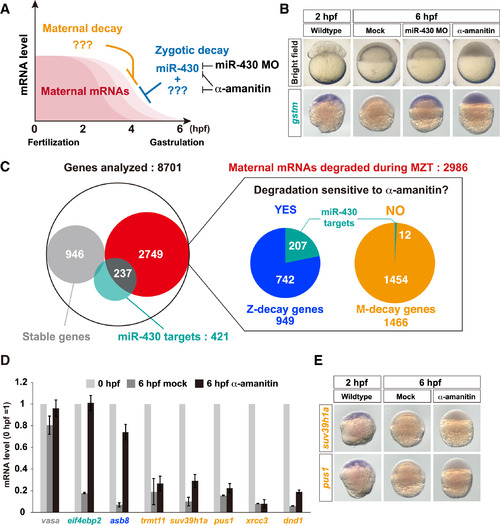
Classification of Maternal mRNA Decay Pathways in Zebrafish (A) A schematic representation of maternal mRNA decay pathways in zebrafish. (B) Bright field pictures (upper panels) and in situ hybridization to detect gstm mRNA (lower panels, purple) in wild-type, miR-430 MO-injected, and α-amanitin-injected embryos. (C) Left: a Venn diagram of the result of the RNA sequencing analysis. Right: pie charts representing subclasses of maternal genes whose mRNAs are degraded during MZT. The numbers show genes in each subclass. (D) qRT-PCR analysis of wild-type and α-amanitin-injected embryos. mRNA levels at 0 hpf were set to one. The graph represents an average of three independent injection experiments. The error bars show SD. (E) In situ hybridization to detect mRNAs of M-decay genes suv39h1a (upper panels) and pus1 (lower panels) in wild-type and α-amanitin-injected embryos. See also Figure S1. |
| Genes: | |
|---|---|
| Fish: | |
| Condition: | |
| Knockdown Reagents: | |
| Anatomical Term: | |
| Stage Range: | 1-cell to Shield |
| Fish: | |
|---|---|
| Condition: | |
| Knockdown Reagents: | |
| Observed In: | |
| Stage: | Shield |