
Fig. 1
|
Fig. 1
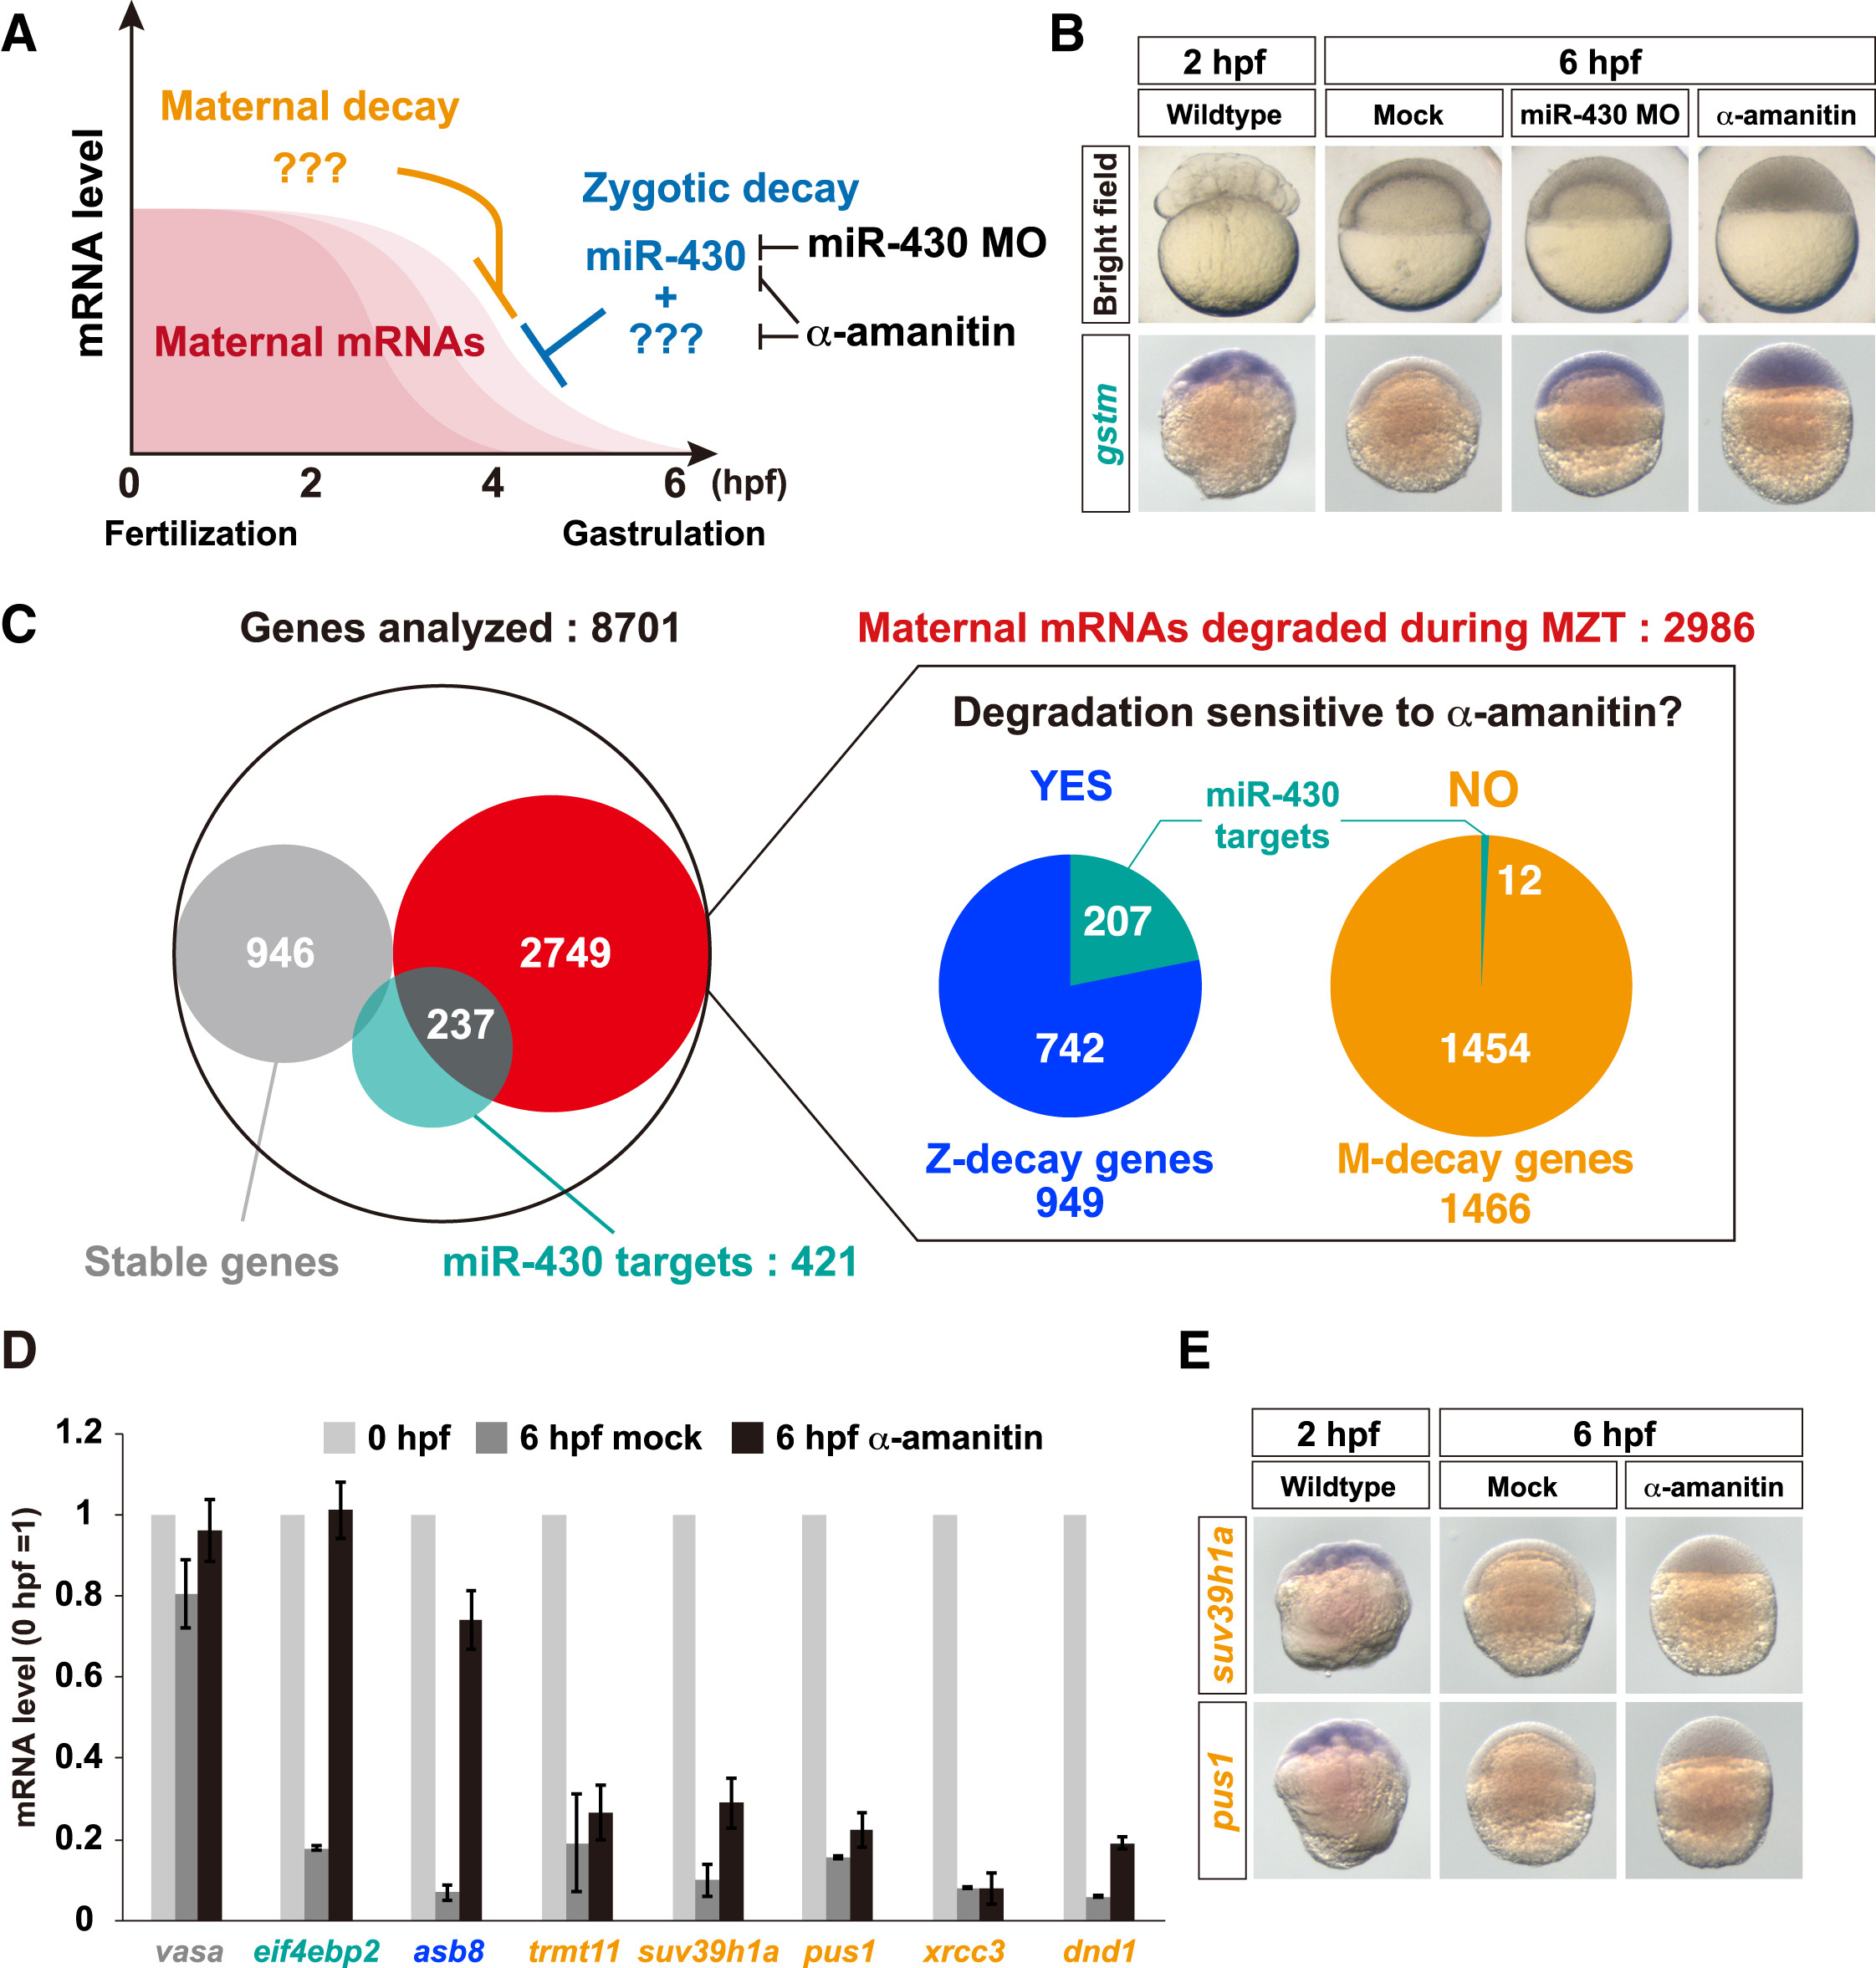
Classification of Maternal mRNA Decay Pathways in Zebrafish
(A) A schematic representation of maternal mRNA decay pathways in zebrafish.
(B) Bright field pictures (upper panels) and in situ hybridization to detect gstm mRNA (lower panels, purple) in wild-type, miR-430 MO-injected, and α-amanitin-injected embryos.
(C) Left: a Venn diagram of the result of the RNA sequencing analysis. Right: pie charts representing subclasses of maternal genes whose mRNAs are degraded during MZT. The numbers show genes in each subclass.
(D) qRT-PCR analysis of wild-type and α-amanitin-injected embryos. mRNA levels at 0 hpf were set to one. The graph represents an average of three independent injection experiments. The error bars show SD.
(E) In situ hybridization to detect mRNAs of M-decay genes suv39h1a (upper panels) and pus1 (lower panels) in wild-type and α-amanitin-injected embryos. See also Figure S1.