Fig. 1
- ID
- ZDB-FIG-160407-5
- Publication
- Shiu et al., 2016 - Knockdown of zebrafish YY1a can downregulate the phosphatidylserine (PS) receptor expression, leading to induce the abnormal brain and heart development
- Other Figures
- All Figure Page
- Back to All Figure Page
|
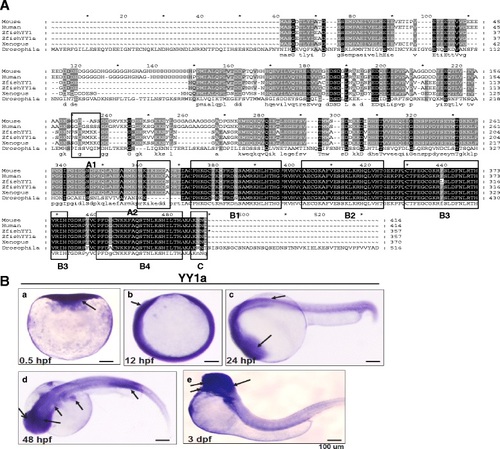
Sequence alignment of zebrafish YY1a and its expression profile. a A sequence alignment of the YY1a protein (where positions of the functional domains are indicated by a series of boxes labeled A-C). Box A contains potential nuclear localization signals (PSGRMKK [118-124 aa] and PRKIKED [227-233 aa]; Fig. 1a, box A1-2). These lie within the predicted intracellular domain (SMART-TMHMM2 program). Box B1-4 contains the potential zinc finger, CH2H2 type, domains (box B1 [CPHKGCTKMFRDNSAMRKHLHTH, residues 241-263, 23 aa], box B2 [CAECGKAFVESSKLKRHQLVH, residues 270-290, 21 aa], box B3 [CTFEGCGKRFSLDFNLRTHVRIH, residues 298-320, 23 aa], and box B4 [CPFDGCNKKFAQSTNLKSHILTH, residues 328-350, 23 aa]), all of which are well characterized as DNA binding modules. Box C (residues 353-356; AKNN for KKXX domain) contains an ER membrane retention signal based on architectural analysis performed with the SMART-TMHMM2 program. b Expression of YY1a from early to late developmental stages detected by in-situ antisense RNA hybridization. YY1a was visualized by blue staining. Lateral view of embryos is shown in panels a-c and e; top view is shown in panel d; anterior is on the right side. (a) One-cell stage (half-hour). YY1a is expressed in all cells examined. b At 12 hpf, YY1a is expressed throughout the embryo. (c) At 24 hpf, YY1a is expressed throughout the embryo, but is especially concentrated within the brain region (indicated by an arrow) and in the anterior part of the embryo. (d) At 48 hpf, YY1a is expressed principally in the posterior notochord (indicated by an arrow) and secondarily in the trunk, brain, kidney, and eyes (indicated by arrows). (e) At 3 dpf, the YY1a is strongly expressed in some major organs (brain, heart, and eyes; indicated by arrows) and mildly expressed throughout the somite. Scale bars denote 100 µm. |
| Gene: | |
|---|---|
| Fish: | |
| Anatomical Terms: | |
| Stage Range: | 1-cell to Protruding-mouth |

