
Fig. S3
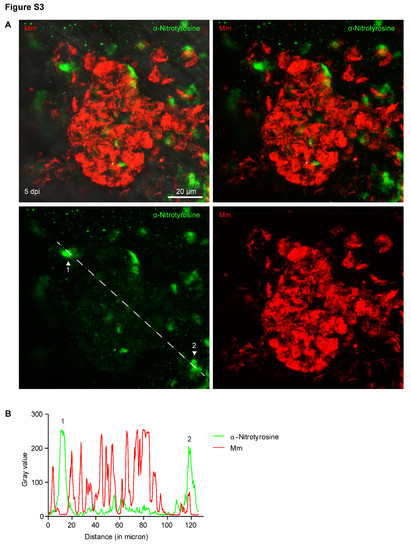
Nitrotyrosine levels in progression granulomas are lower when co-localized with bacteria. (A) Example fluorescence confocal micrographs of anti-nitrotyrosine staining performed on 5 dpi granuloma structures in wild type embryos infected with Mm. A merged image of extended focus is shown in the top left panel while the signal Z-plane used for the measurements is shown in the top right panel. (B) Gray values of the bacterial and anti-nitrotyrosine fluorescence signals measured along a straight line through the center of the granuloma (see white lines in (A)), intensity of the fluorescent signal was measured using ImageJ. Numbered peaks in the graphs correspond to numbered patches of tyrosine nitration in (A). |