
FIGURE
Fig. 3
Fig. 3
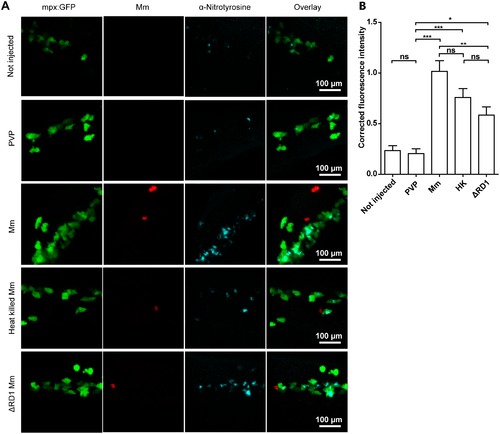
Injection with live, heat-killed or ΔRD1 Mm increased tyrosine nitration levels. (A) Example fluorescence confocal z-stacks of the caudal vein region of embryos stained with anti-nitrotyrosine antibody, imaged 1 day after injection with live, heat killed or ΔRD1 Mm in comparison with uninjected embryos or embryos injected with 2% PVP carrier solution. (B) Corrected fluorescence intensity levels of anti-nitrotyrosine antibody confocal z-stacks of equal size 1 day after injection with live, heat killed or ΔRD1 Mm. Data shown are mean � SEM, n = 58-99 cells from 15 embryos combined from 3 independent experiments. |
Expression Data
| Gene: | |
|---|---|
| Antibody: | |
| Fish: | |
| Condition: | |
| Anatomical Term: | |
| Stage: | Long-pec |
Expression Detail
Antibody Labeling
Phenotype Data
Phenotype Detail
Acknowledgments
This image is the copyrighted work of the attributed author or publisher, and
ZFIN has permission only to display this image to its users.
Additional permissions should be obtained from the applicable author or publisher of the image.
Full text @ PLoS One