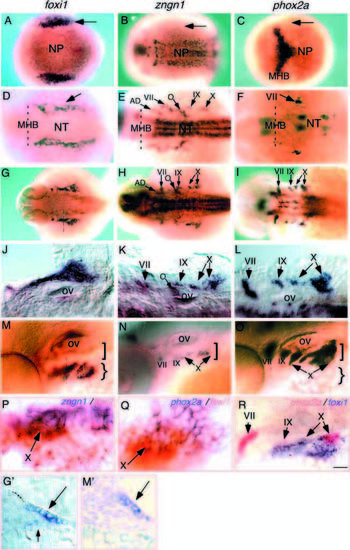
Spatial and temporal expression of no soul/foxi1, ngn and phox2a. In situ hybridization with antisense no soul/foxi, ngn, or phox2a RNA probe. Anterior is to the left, except in G and 3M inset, where dorsal is at the top. (A-C) Dorsal view of tailbud stage embryo showing no soul/foxi1 expression in the lateral cranial placodal domain (epibranchial and otic placodes; arrows), while ngn and phox2a are not yet detectable in this domain. (D-F) Dorsal views of 24 hpf embryos showing persistent expression of foxi1 (arrow) in the lateral cranial placodal region, while ngn and phox2a expression are detected in the vicinity of foxi1. (G-L) Dorsal views of 36 hpf embryos showing that all three genes are expressed in close proximity to one another. (G′; below) A cross section through the foxi1-expressing domain: the large arrow points to foxi1-expressing cells in the ectodermal layer, while the small arrow points to cells weakly expressing foxi1 that are likely delaminating neural precursors. (M-O) Lateral views of 48 hpf embryos. (M′; below) A cross section through the foxi1-expressing domain: the arrow points to the foxi1-expressing cells. (P,Q) Double in situ hybridization showing the overlapping expression of foxi1 (red) and ngn (P) or phox2a (Q) (purple). The arrow indicates the nodose (X) ganglionic region. (R) Double in situ hybridization showing the overlapping expression of phox2a (red) and foxi1 (purple). All three epibranchial placode-derived sensory ganglionic regions are indicated with arrows. AD, anterior dorsal lateral line; MHB, mid-hindbrain boundary; NP, neural plate; NT, neural tube; O, octaval/statoacoustic ganglion; ov, otic vesicle; VII, geniculate ganglion; IX, petrosal ganglion; X, nodose ganglion. Scale bar: 150 μm (A-F, G-I), 100 μm (M-O), 50 μm (J-L,R), 25 μm (G′,M′), 10 μm (P,Q).
|

