
FIGURE
Fig. S4
Fig. S4
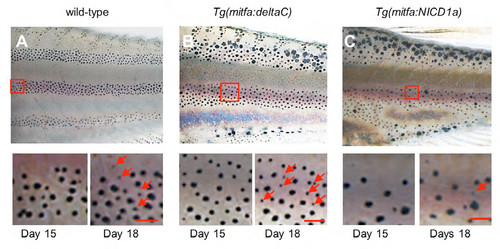
Recovery of melanophores after the removal of DAPT. (A-C) After 15 day DAPT treatment, fish were moved to normal water. To assess the recovery, melanophore distributions were compared between day 15 and day 18. Red arrows show newly differentiated melanophores. In wild-type and Tg(mitfa:deltaC) transgenic fish, new melanophores developed rapidly, whereas no changes were observed for Tg(mitfa:NICD1a) transgenic fish. Scale bars: 100μm. |
Expression Data
Expression Detail
Antibody Labeling
Phenotype Data
Phenotype Detail
Acknowledgments
This image is the copyrighted work of the attributed author or publisher, and
ZFIN has permission only to display this image to its users.
Additional permissions should be obtained from the applicable author or publisher of the image.
Full text @ Development