
FIGURE
Fig. 3
Fig. 3
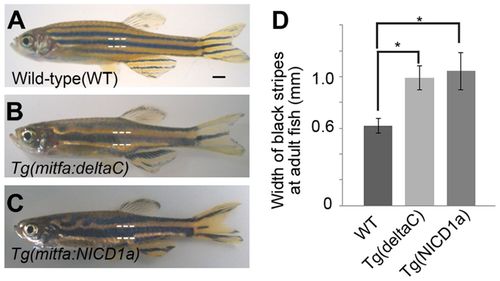
Ectopic expression of DeltaC and Notch-NICD alter stripes. (A-C) Expression of DeltaC (B) and the Notch1a intracellular domain (C) in melanophores resulted in fewer, wider stripes than those in wild type (A). (D) Width of black stripes in transgenic fish [wild type, n=12; Tg(mitfa:deltaC), n=12; Tg(mitfa:NICD1a), n=13]. *P<0.0001 (Student?s t-test). Error bars represent s.d. Scale bar: 1 mm. |
Expression Data
Expression Detail
Antibody Labeling
Phenotype Data
| Fish: | |
|---|---|
| Observed In: | |
| Stage Range: | Days 30-44 to Adult |
Phenotype Detail
Acknowledgments
This image is the copyrighted work of the attributed author or publisher, and
ZFIN has permission only to display this image to its users.
Additional permissions should be obtained from the applicable author or publisher of the image.
Full text @ Development