
FIGURE
Fig. S3
Fig. S3
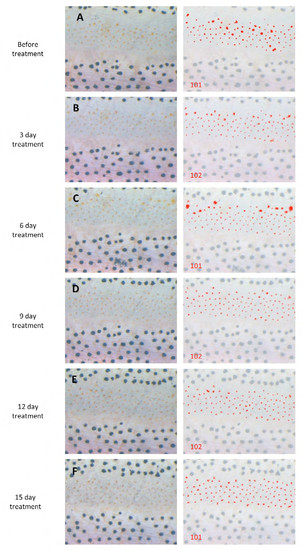
Xanthophores were not affected by DAPT treatment. (A-F) Left panels are original images. In right panels, xanthophores we counted are marked by red overlay. The number of xanthophores is shown at the bottom-left of each panel. Scale bar: 500 μm. |
Expression Data
Expression Detail
Antibody Labeling
Phenotype Data
Phenotype Detail
Acknowledgments
This image is the copyrighted work of the attributed author or publisher, and
ZFIN has permission only to display this image to its users.
Additional permissions should be obtained from the applicable author or publisher of the image.
Full text @ Development