
FIGURE
Fig. 4
Fig. 4
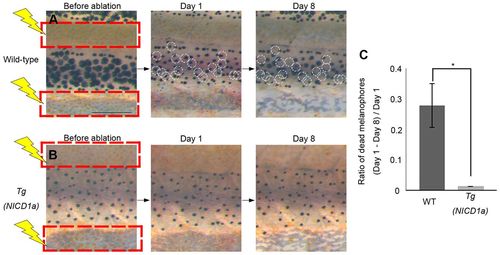
Melanophore survival is independent of xanthophores in Tg(mitfa:NICD1a) transgenic fish. (A,B) Effects on melanophores after ablation of xanthophores is shown for wild type (A) and Tg(mitfa:NICD1a) (B). Red squares indicate the areas in which xanthophores were ablated. White circles indicate melanophores present on day 1 but lost by day 8. (C) Proportion of melanophores that died in wild-type and Tg(mitfa:NICD1a) fish (n=5, respectively). *P<0.0001 (Student?s t-test). Error bars represent s.d. Scale bar: 500 μm. |
Expression Data
Expression Detail
Antibody Labeling
Phenotype Data
Phenotype Detail
Acknowledgments
This image is the copyrighted work of the attributed author or publisher, and
ZFIN has permission only to display this image to its users.
Additional permissions should be obtained from the applicable author or publisher of the image.
Full text @ Development