
Fig. 1
- ID
- ZDB-FIG-140131-22
- Publication
- Antinucci et al., 2013 - Teneurin-3 specifies morphological and functional connectivity of retinal ganglion cells in the vertebrate visual system
- Other Figures
- All Figure Page
- Back to All Figure Page
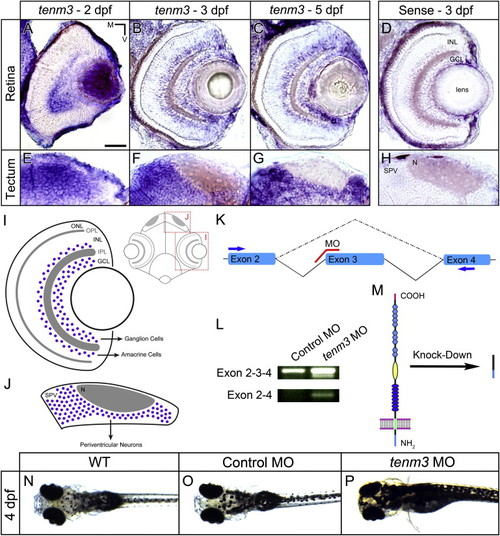
Teneurin-3 Is Expressed in Interconnected Regions of the Zebrafish Visual System (A?C) Retinal cryosections of whole-mount in situ hybridizations showing tenm3 mRNA expression at 2, 3, and 5 dpf. (D and H) Control in situ hybridizations using sense tenm3 riboprobe. (E?G) Tectal cryosections of whole-mount in situ hybridizations showing tenm3 mRNA expression at 2, 3, and 5 dpf. All images are in transverse plane. Scale bar, 40 μm. N, neuropil; M, medial; V, ventral. (I) Schematic showing the expression pattern of tenm3 in the retina. Tenm3-positive cells are represented as blue circles. Neuropil layers are indicated in gray. Anatomical reference is reported on the right. IPL, inner plexiform layer; ONL, outer nuclear layer; OPL, outer plexiform layer. (J) Schematic showing the expression pattern of tenm3 in the optic tectum. (K) Schematic detailing the targeting site of splice-blocking tenm3 morpholino (MO), which is shown in red. Exons are represented in cyan. Solid lines indicate introns. The dashed line indicates exon 3 deletion caused by tenm3 MO injections. Primers used for RT-PCR (L) are reported as blue arrows. (L) RT-PCR analysis of tenm3 mRNA structure in control MO- and tenm3 MO-injected embryos. Two shorter splice variants are distinguished in tenm3 morphants. cDNA sequence comparison revealed that the shortest splice variant lacks exon 3. (M) Schematic detailing the effect of exon 3 deletion caused by the splice-blocking tenm3 MO, resulting in the deletion of Tenm3 transmembrane and extracellular domains. The full-length protein is represented on the left. The N terminus is located intracellularly, whereas the C terminus is in the extracellular space. (N?P) At 4 dpf, tenm3 morphant larvae fail to visually adapt their skin pigmentation to the level of background illumination. See also Figure S1. |
| Gene: | |
|---|---|
| Fish: | |
| Anatomical Terms: | |
| Stage Range: | Long-pec to Day 5 |
| Fish: | |
|---|---|
| Knockdown Reagent: | |
| Observed In: | |
| Stage: | Day 4 |