FIGURE

Fig. S2

ID
ZDB-FIG-140131-21
Publication
Antinucci et al., 2013 - Teneurin-3 specifies morphological and functional connectivity of retinal ganglion cells in the vertebrate visual system
Other Figures
All Figure Page
Back to All Figure Page
Fig. S2

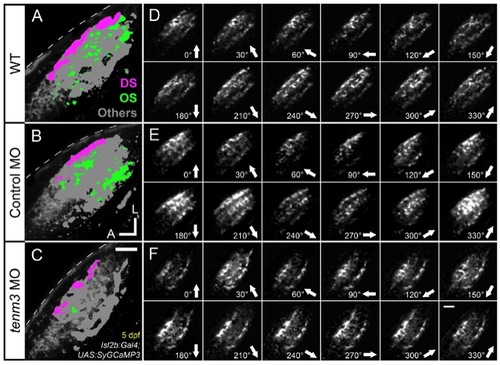
RGC Functional Responses to Drifting Bars, Related to Figure 5 and Movies S1-S3
(A-C) Parametric maps of single 5 dpf Tg(Isl2b:Gal4;UAS:SyGCaMP3) larvae (one larva per animal group) representing the spatial distribution of direction-selective (DS, magenta), orientationselective (OS, green) and other visually responsive voxels (others, grey) superimposed onto the mean fluorescence images of SyGCaMP3-expressing axons (greyscale). Note that the tenm3 morphant larva (C) shows substantially less OS voxels than WT and control MO-injected larvae (A and B). Dashed lines indicate the skin overlaying the tectum. (D-E) Montages showing integral responses (grayscale) of all voxels (RGC axons expressing SyGCaMP3) in the tectal neuropil of the larvae described in (A-C). Note that all three larvae exhibit complex response patterns to moving bars. Direction of motion is shown on the bottom right in each panel. Scale bars = 20 μm. A, anterior; L, lateral. The three representative larvae shown in (A-E) are the same used to generate Movies S1-S3.

Expression Data

Expression Detail
Antibody Labeling
Phenotype Data

Phenotype Detail
Acknowledgments
This image is the copyrighted work of the attributed author or publisher, and ZFIN has permission only to display this image to its users. Additional permissions should be obtained from the applicable author or publisher of the image. Full text @ Cell Rep.