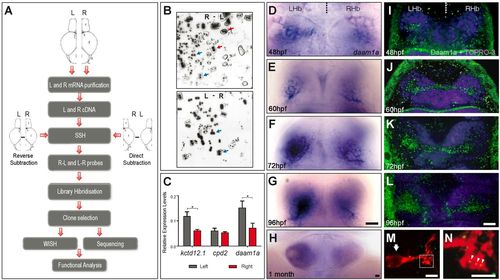
Identification of daam1a as a novel gene with asymmetric expression in the zebrafish brain. (A) Strategy for the identification of sequences differentially expressed in left and right sides of the juvenile zebrafish brain. For details, see text. (B) Radioautography images obtained after library hybridisation with probes obtained from direct (top) and reverse (bottom) SSH. Arrows indicate examples of selected clones hybridised by a single SSH condition (red), or showing differential hybridisation intensity between both conditions (blue). (C) Quantitative assessment of kctd12.1 (control asymmetric gene enriched on the left side), cpd2 (control symmetric gene) and daam1a mRNA expression in left (grey) and right (red) halves of juvenile brains. Asterisks indicate statistically significant differences between left and right brain (n=10), after Mann-Whitney test: kctd12.1 (P<0.004); daam1a (P<0.025). Error bars represent standard errors. (D-H) Expression of daam1a mRNA after whole-mount in situ hybridisation in embryonic (D-F), larval (G) and juvenile (H) zebrafish. (I-L) Expression of Daam1a protein visualised by confocal microscopy after whole-mount indirect immunofluorescence (green) in embryonic (I-K) and larval (L) zebrafish. TO-PRO-3 was used as nuclear counterstain (purple). Images in D-L are dorsal views, with anterior to the top. (M,N) Maximum intensity confocal projections showing a single habenular neuron labelled through focal electroporation of pCS2-GAP43-mCherry (red) and immunostained against Daam1a (green). The arrow in M indicates the neuronal soma. The punctate distribution of Daam1a in dendrites is shown by arrowheads in panel N, which corresponds to a magnification view of the boxed region in M. L, left; LHb, left Hb; R, right; RHb, right Hb. Scale bars: 20 μm (D-L); 4 μm (M,N).
|

