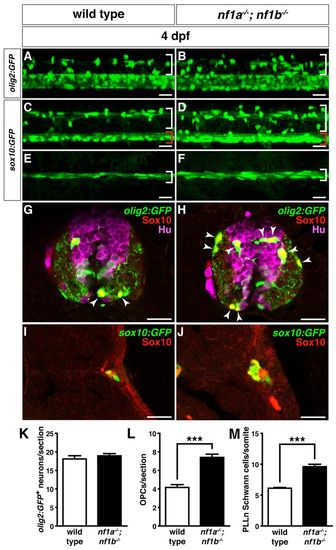
Loss of nf1a and nf1b causes hyperplasia of OPCs and Schwann cells. (A,B) Confocal images of spinal cords in nf1a-/-; nf1b-/-; Tg(olig2:GFP) larvae (B) demonstrate increased numbers of dorsally migrating (white brackets) olig2:GFP-positive OPCs as compared with wild-type; Tg(olig2:GFP) larvae (A) at 4 dpf. (C,D) Confocal images of spinal cord in nf1a-/-; nf1b-/-; Tg(sox10:GFP) larvae (D) demonstrate increased numbers of both dorsally (white brackets) and ventrally (red brackets) positioned sox10:GFP-positive OPCs as compared with wild-type; Tg(sox10:GFP) larvae (C) at 4 dpf. (E,F) nf1a-/-; nf1b-/-; Tg(sox10:GFP) larvae (F) show an increased number of sox10:GFP-positive Schwann cells associated with the peripheral lateral line nerve (PLLn; white brackets) as compared with wild-type; Tg(sox10:GFP) larvae (E) at 4 dpf. (G,H) Neuronal numbers (olig2:GFP- [green], HuC/D- [magenta] positive) do not increase in concert with OPCs (olig2:GFP- [green], Sox10- [red] positive; arrowheads) in transverse sections through the spinal cord of nf1a/; nf1b-/-; Tg(olig2:GFP) larvae (H) as compared to wild-type; Tg(olig2:GFP) larvae (G) at 4 dpf. (I,J) Increased numbers of PLLn Schwann cells (sox10:GFP- [green], Sox10- [red] positive) are appreciated in transverse sections of nf1a-/-; nf1b-/-; Tg(sox10:GFP) larvae (J) as compared with wild-type; Tg(sox10:GFP) (I) larvae at 4 dpf. (K,L) Quantification of neurons (olig2:GFP-, HuC/D-positive cells) (K) and OPCs (olig2:GFP-, Sox10-positive cells) (L) from transverse sections through the spinal cord of wild-type; Tg(olig2:GFP) and nf1a-/-; nf1b-/-; Tg(olig2:GFP) larvae at 4 dpf. Values indicate mean + s.e.m. per section (n=30 from five each of wild-type and nf1a/; nf1b-/- larvae). (M) Quantification of sox10:GFP-positive Schwann cells in the PLLn of wild-type; Tg(sox10:GFP) and nf1a-/-; nf1b-/-; Tg(sox10:GFP) larvae at 4 dpf. Values indicate mean + s.e.m. per hemisegment (n=5 each for wild-type and nf1a-/-; nf1b-/- larvae). ***P<0.001. Scale bars: 20 μm.
|

