
Fig. 7
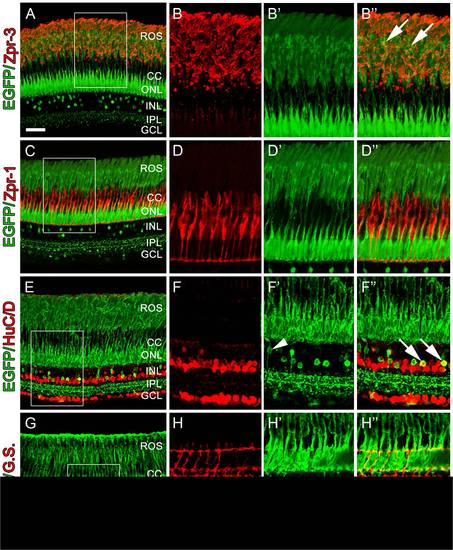
Retinal sections from adult Tg(nrd:egfp)/albino zebrafish. (A) Immunolocalization of GFP (green) to visualize the nrd:egfp transgene and Zpr-3 to visualize rod photoreceptors. (B) Higher magnification inset of (A) showing Zpr-3 immunolocalization in rods. (B′) Overlay image showing that the transgene is present in rod photoreceptors and co-labels with rod inner and out segments. (C) Immunolocalization of GFP (green) to visualize the nrd:egfp transgene and Zpr-1 (red) to visualize double cones. (D) Higher magnification inset of (A) showing Zpr-1 immunolocalization in double cones. (D′) Overlay image showing that EGFP is restricted to rod photoreceptor soma and outer segments and does not co-label with double cones. (E) Immunolocalization of GFP (green) to visualize the nrd:egfp transgene and HuC/D (red) to visualize all amacrine and ganglion cells. (F) Higher magnification inset of (C) showing HuC/D expression in amacrine and ganglion cells only. (F′) Overlay image showing co-labeling of EGFP with a subset of HuC/D-positive amacrine cells (arrows) and a HuC/D-negative bipolar cell extending its processes from the photoreceptors to the IPL (arrowhead). (G) Immunolocalization of GFP (green) to visualize the nrd:egfp transgene and Glutamine Synthetase (G.S.; red) to visualize all Müller glial cells. (H) Higher magnification inset of (E) showing G.S.-positive Müller glial cells. (H′) Overlay image showing that EGFP does not co-label with G.S.-positive Müller glial cells. ROS, rod outer segments; CC, cone cells; ONL, outer nuclear layer; INL, inner nuclear layer; IPL, inner plexiform layer; GCL, ganglion cell layer. Scale bar: 50 microns (A, C, E, G). |