Fig. 2
|
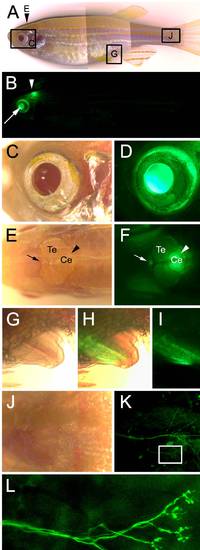
Wholemount brightfield and fluorescent images showing nrd:egfp trangene expression in adult Tg(nrd:egfp)/albino zebrafish. (A) A multiple brightfield image overlay showing the entire adult fish. Arrowhead indicates the location of the pineal gland and cerebelum (shown in Panels E and F). The boxes and corresponding panel letter indicate the location of the higher magnification images shown in Panels C?K. (B) Corresponding fluorescent image to Panel A, showing EGFP expression in the eye (white arrow) and the pineal (white arrowhead). (C?D) Brightfield and corresponding fluorescent image showing EGFP expression in the eye. (E) Brightfield image of the dorsal side of the head showing the pineal gland (arrow), telecephalon (Te), and cerebellum (Ce, arrowhead). (F) Corresponding fluorescent image showing EGFP expression in the pineal gland (arrow) and cerebellum (arrowhead). (G?I) Brightfield, overlay, and fluorescent images of the anus and its expression of the transgene. (J?K) Brightfield and corresponding fluorescent image showing EGFP expression in nerves located near the girdle of the tail fin. The box indicates the location of image shown in Panel L. (L) A high magnification fluorescent image of a branch of the nerve shown in Panel K, most likely of the posterior lateral line, showing EGFP expression in each of the terminating synaptic buttons. Scale bar: 2 mm (A). |

