Fig. 2
|
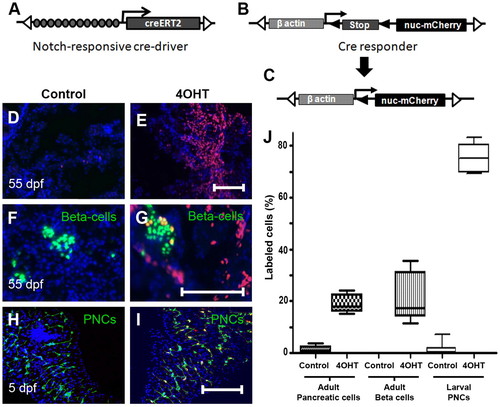
Regulation of Cre-recombinase activity in the pancreas. (A) Schematic of Notch responsive Cre-driver transgene Tp1:creERT2 and (B) the Cre-responder transgene βactin:loxP-stop-loxP-hmgb1-mCherry. (A) Tol2 arms (open triangles) flank 12 RBP-Jκ-binding sites (gray circles), the β-globin minimal promoter (arrow) and the gene encoding the 4OHT-regulated Cre recombinase (CreERT2). (B) The β-actin enhancer/promoter upstream of a loxP-flanked (black triangles) translational stop. (C) Following Cre-dependent recombination, the stop cassette is removed, allowing transcription of a gene encoding nuclear Hmgb1-mCherry (nuc-mCherry). (D-G) Sections through adult pancreas (55 dpf) from GIFM fish. (D) Limited Cre-activity is evident without 4OHT. (E) Treatment with 4OHT at 56 hpf results in widespread labeling in adult (55 dpf) pancreatic tissue. (F,G) β-Cells are marked green in GIFM/ins:hmgb1-eGFP fish. (F) Without larval exposure to 4OHT, β-cells are not labeled with red fluorescent Hmgb1-mCherry. (G) With larval 4OHT treatment (at 56 hpf), adult β-cells are labeled. (H,I) Micro-dissected pancreata from 5 dpf GIFM/Tp1:eGFP larvae. PNCs are marked by GFP fluorescence. (I) 4OHT incubation from 56-80 hpf results in Cre-dependent labeling of 75% PNCs by 5 dpf. DAPI used to counterstain nuclei (D-I). (J) Box plots quantifying results shown in D-I. Scale bars: 100 μm in E,G,I. |

